Support And Resistance are among the most widely used trading strategies in financial markets. Identifying these zones allows traders to determine potential entry and exit points, and anticipate market reactions. The Support and Resistance Indicator for MetaTrader 4 (MT4) is a technical tool designed to automate this process, making it easier for traders to spot key zones across multiple timeframes.
This indicator automatically scans different timeframes, such as H4, D1, W1, and MN, and displays the corresponding support and resistance lines on the chart you are trading. For example, if you are analyzing an H4 chart, the indicator will also show support and resistance levels from higher timeframes, giving you a complete multi-timeframe perspective.
How Forex Support and Resistance Are Identified
Support and resistance zones are price levels where the market tends to react, either reversing or pausing before continuing in the same direction.
Support zones are typically found around lower lows, where buying interest may emerge.
Resistance zones are identified near higher highs, where selling pressure may appear.
Psychological levels such as round numbers (e.g., 1.4200, 1.5000) often act as natural support or resistance zones.
By understanding these areas, traders can anticipate market movements and make informed trading decisions.
How Support and Resistance Lines Are Drawn
Support and resistance lines can be drawn using:
Trend lines connecting two or more peaks (resistance) or troughs (support)
Horizontal lines marking key price levels
The Support And Resistance Indicator for MT4 automates this process, drawing lines for multiple timeframes directly on the chart. This saves time and eliminates guesswork, especially for novice traders still learning to spot these levels manually.
How to Trade with the Support and Resistance Indicator
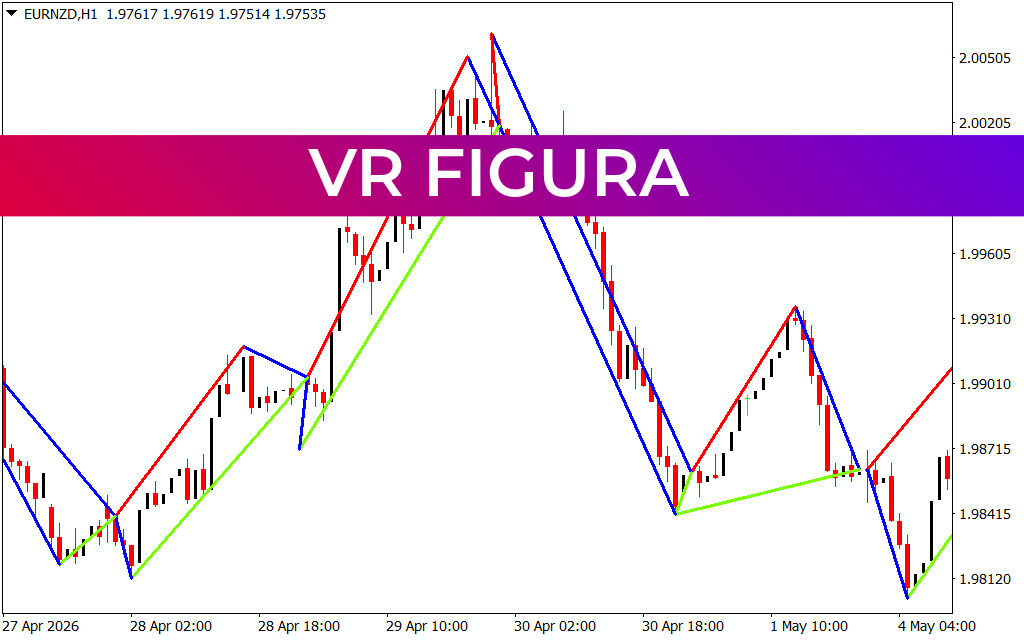
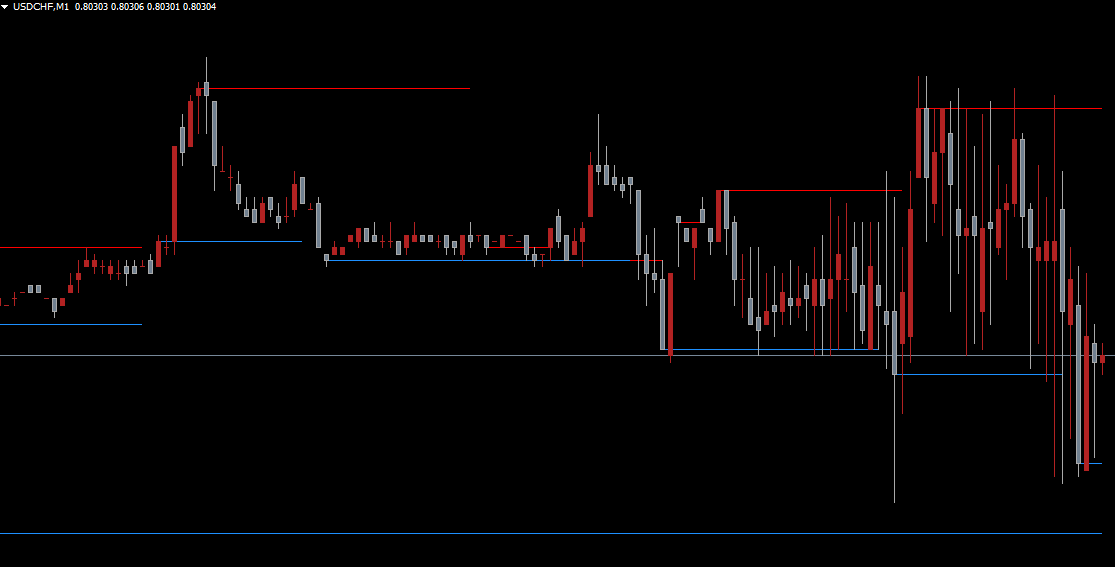
On your MT4 chart, the indicator displays:
RED lines for resistance zones
DODGER BLUE lines for support zones
Traders can use the indicator for both Trend Reversal and Trend Continuation strategies.
Trend Reversal Trading
When price approaches a support zone and shows bullish reversal patterns, consider entering a BUY trade.
When price approaches a resistance zone and forms bearish reversal patterns, consider a SELL trade.
Trend Continuation Trading
When price breaks a support zone, the zone can act as future resistance.
When price breaks a resistance zone, the zone can act as future support.
Enter trades in the direction of the breakout for trend continuation strategies.
By combining Price Action patterns with the automatically drawn support and resistance zones, traders can enhance the accuracy of their trades.
Advantages of the Support and Resistance Indicator
Multi-timeframe analysis on a single chart
Automatic detection of key levels for faster analysis
Clear visual cues with color-coded lines
Useful for scalping, intraday, swing trading, and trend-following strategies
Simplifies technical analysis for beginners while saving time for advanced traders
This makes the indicator a versatile tool suitable for all levels of forex traders.
Conclusion
The Support and Resistance Indicator for MT4 simplifies technical analysis by automatically drawing critical zones across multiple timeframes. Traders can quickly identify potential reversal and continuation points, improving decision-making and reducing analysis time. The indicator is free to download and easy to use, making it an essential tool for any forex trader looking to enhance their chart-based strategies.
FAQ
14 Downloads
Published:
Nov 29, 2025 11:37 AM
Category: