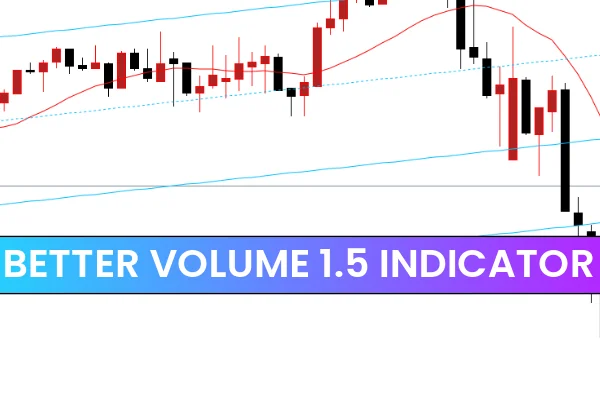
The BetterVolume 1.5 indicator analyzes the activity of Forex market participants and plots a multi-colored histogram that visualizes trading volumes in a more detailed way than the standard MT5 Volume indicator.
In Forex, it’s impossible to calculate the exact number of opened lots due to the decentralized nature of the market. Because of this, traders use tick The BetterVolume 1.5 indicator analyzes the activity of Forex market participants and plots a multi-colored histogram that visualizes trading volumes in a more detailed way than the standard MT5 Volume indicator.
In Forex, it’s impossible to calculate the exact number of opened lots due to the decentralized nature of the market. Because of this, traders use tick volume, which reflects the number of price changes over a specific time interval.
The BetterVolume 1.5 indicator is valuable because it accurately separates different types of market activity based on the number of executed trades. This allows traders to better understand the motives and behavior of market participants and incorporate volume data into their own trading system.
Features of Better Volume 1.5
BetterVolume 1.5 is an enhanced version of the default MetaTrader 5 Volumes indicator.
Here are the key improvements:
Advanced Filtering
The standard MT5 volume indicator only shows rising and falling tick volume.
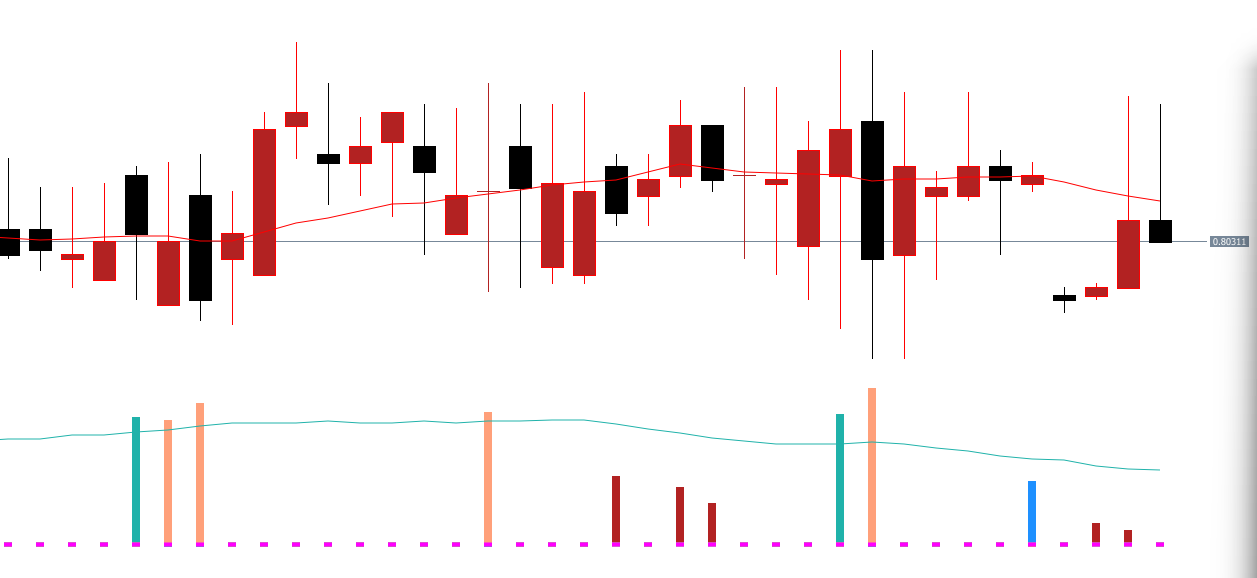
BetterVolume 1.5, however, categorizes tick volumes using multiple color-coded filters, making it easier to interpret trader activity.
Built-in Moving Average
The indicator includes a moving average line that acts as an additional signal when the line crosses above or below the volume bars. This feature helps confirm changes in market participation.
Volume Categories (Color Codes)
Informational Volumes
White: Normal market volume
Red: Low volume → market uncertainty; avoid trading
Blue: High volume due to participant repositioning → avoid trading because direction is unclear
Trading Volumes
SeaGreen: Increase in buyer activity (bullish pressure)
Orange: Increase in seller activity (bearish pressure)
SeaGreen and Orange bars indicate potential buy or sell opportunities, but these should always be confirmed by the dominant trend and overall Market Structure.
Buy and Sell Strategies with BetterVolume 1.5
Trading based solely on volume can be risky. Therefore, BetterVolume 1.5 signals should always be analyzed alongside market sentiment and the prevailing trend.
Buy Strategy Example
Identify an uptrend using price structure or trendlines.
Look for SeaGreen bars (rising buyer activity).
Enter a Buy position once the bullish volume confirms the trend direction.
Stop Loss: Below the trendline or previous swing low.
Exit the trade when an opposite (Orange) bar appears or when price breaks below the trendline.
Sell Strategy Example
Confirm a downtrend.
Watch for Orange bars indicating seller dominance.
Enter a Sell position when bearish volume aligns with the trend.
Stop Loss: Above the trendline or previous swing high.
Exit when SeaGreen volume appears or trend structure breaks.
Volume-based entries become far more reliable when combined with support/resistance, trendlines, or moving averages.
Indicator Settings (Overview)
(If you want, I can generate a full Settings table.)
The settings allow you to:
Customize histogram colors
Adjust the moving average period
Enable or disable alerts
Control volume thresholds
These inputs help tailor the indicator to different trading styles, from Scalping to swing trading., which reflects the number of price changes over a specific time interval.
The BetterVolume 1.5 indicator is valuable because it accurately separates different types of market activity based on the number of executed trades. This allows traders to better understand the motives and behavior of market participants and incorporate volume data into their own trading system.
Features of Better Volume 1.5
BetterVolume 1.5 is an enhanced version of the default MetaTrader 5 Volumes indicator.
Here are the key improvements:
FAQ
18 Downloads
Published:
Nov 29, 2025 10:51 AM
Category: