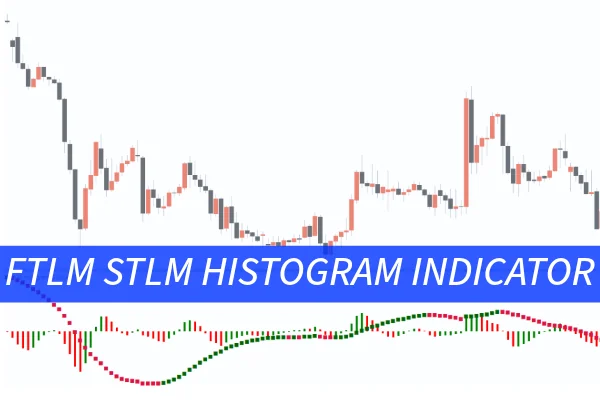
The FTLM STLM Histogram Indicator is a powerful momentum-based trading tool designed to help traders detect changes in market direction with ease. Based on the Fast Trend Line Momentum (FTLM) and Slow Trend Line Momentum (STLM) calculations, this indicator visualizes shifts in buying and selling pressure through a color-coded histogram.
By displaying the balance between bullish and bearish forces, the FTLM STLM Histogram Indicator gives traders a clear and instant overview of trend strength. Whether you’re trading forex, crypto, stocks, or commodities, this indicator is designed to improve your technical analysis and refine your entry and exit strategies.
The FTLM STLM Histogram combines two momentum measures—FTLM, which responds quickly to price action, and STLM, which reacts more gradually. This dual approach provides a comprehensive view of market dynamics, allowing traders to anticipate potential reversals before they occur.
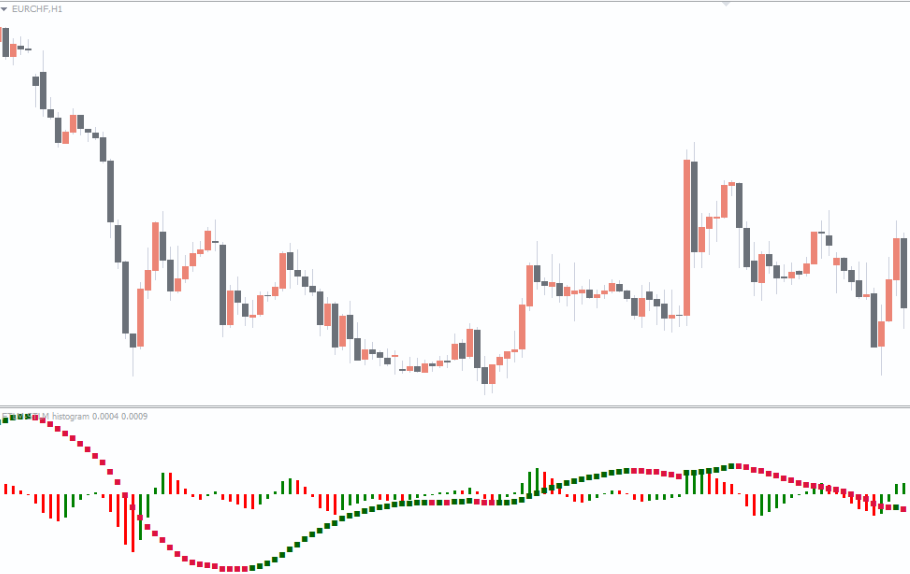
When the FTLM crosses above the STLM, the histogram bars turn green, suggesting increasing bullish momentum and the start of an uptrend. Conversely, when the FTLM moves below the STLM, the bars switch to red, indicating bearish pressure and the potential for a downtrend.
This color-coded display allows traders to visualize the strength and direction of the market trend in real-time without cluttering their charts with multiple indicators.
The FTLM STLM Histogram Indicator generates clear, easy-to-read signals based on changes in the histogram’s size and color:
🟩 Green Bars Expanding Upward: Indicate growing bullish momentum, signaling a potential buying opportunity.
🟥 Red Bars Expanding Downward: Suggest increasing bearish pressure, signaling a potential sell setup.
⚪ Alternating Colors or Smaller Bars: Indicate market indecision or consolidation, suggesting that traders should wait for a breakout confirmation.
Traders can use these signals alongside price action and other tools like moving averages, RSI, or MACD to confirm entries and exits.
The indicator offers several benefits that make it ideal for both new and professional traders:
Visual clarity: Quickly identify whether the market is gaining or losing momentum.
Early trend detection: Recognize potential trend reversals before price confirmation.
Versatility: Works across multiple markets and timeframes—from 1-minute charts to daily or weekly setups.
Ease of use: Simple color-coded interface, ideal for beginner traders learning technical analysis.
By integrating the FTLM STLM Histogram Indicator into your trading strategy, you gain a competitive edge in identifying profitable setups and avoiding false signals.
To maximize its potential, combine the FTLM STLM Histogram Indicator with:
Support and Resistance Levels: Confirm signals where price aligns with key zones.
Volume Indicators: Validate momentum shifts with corresponding volume changes.
Algorithmic Trading Strategies: Automate entries based on histogram behavior for consistent execution.
For advanced traders, pairing this indicator with algorithmic systems or AI-based strategies can enhance accuracy and efficiency in detecting market opportunities.
The FTLM STLM Histogram Indicator is particularly valuable in algorithmic trading setups, where precise signal generation is critical. Its quantifiable nature allows developers to code robust trading algorithms that respond to histogram color and size changes.
If you’re developing custom trading bots or using MT4/MT5 Expert Advisors, integrating this indicator can significantly enhance your model’s ability to recognize momentum-based trend shifts.
The FTLM STLM Histogram Indicator is an essential tool for traders who rely on momentum analysis to fine-tune their trades. By offering a visually intuitive representation of market strength, it helps identify trend direction and potential reversals with precision.
Whether you’re trading forex, stocks, or commodities, the FTLM STLM Histogram Indicator can help you make more confident trading decisions.
👉 Visit IndicatorForest.com today to download the FTLM STLM Histogram Indicator and take your trading analysis to the next level.
Published:
Oct 14, 2025 05:05 AM
Category: