The Standard Deviation Channel Indicator for MT4 is a reliable tool that automatically plots dynamic trading channels using the standard deviation of price. These channels act as Support And Resistance levels, helping forex traders identify BUY, SELL, STOP LOSS, and TAKE PROFIT levels accurately. It is ideal for both beginner and advanced traders, providing clear visual cues for bullish and bearish market conditions.

With inside and outside channel lines, the indicator supports all intraday timeframes as well as long-term trading. The tool is easy to install, free to download, and simplifies decision-making by automatically generating mathematically accurate channels.
How the Standard Deviation Channel Indicator for MT4 Works
Dynamic Support and Resistance Zones
The indicator plots three main lines:
Outer Channel Lines: Strong support/resistance
Inner Channel Lines: Moderate support/resistance
Midline (Center Line): Trend direction indicator
These lines help traders identify potential reversals or breakout zones. When price interacts with the upper or lower boundaries, it signals trend changes—similar to Bollinger Bands but calculated with standard deviation for more precision.
Bullish and Bearish Confirmation
The MT4 version visually identifies trend direction:
BULLISH trend: Price rises above the midline
BEARISH trend: Price closes below the midline
This makes spotting market momentum simple and clear.
How to Trade Using the Standard Deviation Channel Indicator for MT4
Buy Signal Strategy
A BUY trade can be initiated when:
Price touches or rises from the inner or outer lower channel.
Price crosses above the midline, confirming bullish momentum.
Take Profit is set at the upper channel.
Stop-Loss is placed near the lower channel.
Aggressive traders may enter BUY trades immediately at the outer lower channel, targeting the opposite upper channel for profits.
Sell Signal Strategy
A SELL trade occurs when:
Price touches or falls from the inner or outer upper channel.
Price crosses below the midline, confirming bearish momentum.
Take Profit is aimed at the lower channel.
Stop-Loss is placed near the upper channel.
Combining this indicator with Market Structure, volume, and intraday S/R levels can enhance trading accuracy.
Chart Example
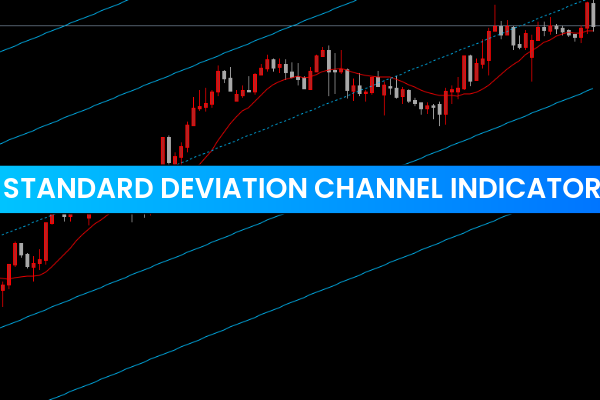
In the USDCAD H1 chart example:
MID line: Dotted Deep Sky Blue
Inside/Outside channel lines: Solid Deep Sky Blue
Price movements around these lines highlight:
BUY opportunities from lower channel touches
SELL opportunities from upper channel touches
Confirmation of trend via midline crossing
This structured approach supports both intra-day and swing trading.
Why Traders Prefer the Standard Deviation Channel Indicator for MT4
Auto-generates support and resistance zones
Displays bullish and bearish trend direction
Works on all timeframes (M1–MN1)
Ideal for beginners and experienced traders
Free and easy to install
Provides precise entry and exit signals
Reduces subjective analysis via mathematical calculation
Explore more free MT4 indicators at IndicatorForest.com.
Conclusion
The Standard Deviation Channel Indicator for MT4 is a versatile tool for channel-based trading. By automatically plotting accurate channels, it allows traders to identify reliable BUY and SELL zones with precision. Whether trading intraday or long-term, this indicator simplifies technical analysis and enhances trading accuracy. Download it today for free from IndicatorForest.com.
FAQ
Published:
Nov 24, 2025 03:12 AM
Category: