The Professional Swing Indicator for MT4 is a powerful trading tool designed to help forex traders identify BUY and SELL signals through colored bars, trend-strength levels, and reversal dots. Traders use this indicator to simplify Market Structure, confirm trends, and refine entries and exits. In this guide, you’ll learn how the indicator works, how to interpret its signals, and the best ways to use it on MetaTrader 4.
By understanding the colored bars, 12-line system, and high/low dots, you’ll be able to apply the Professional Swing Indicator confidently in your trading strategy.
What Is the Professional Swing Indicator for MT4?
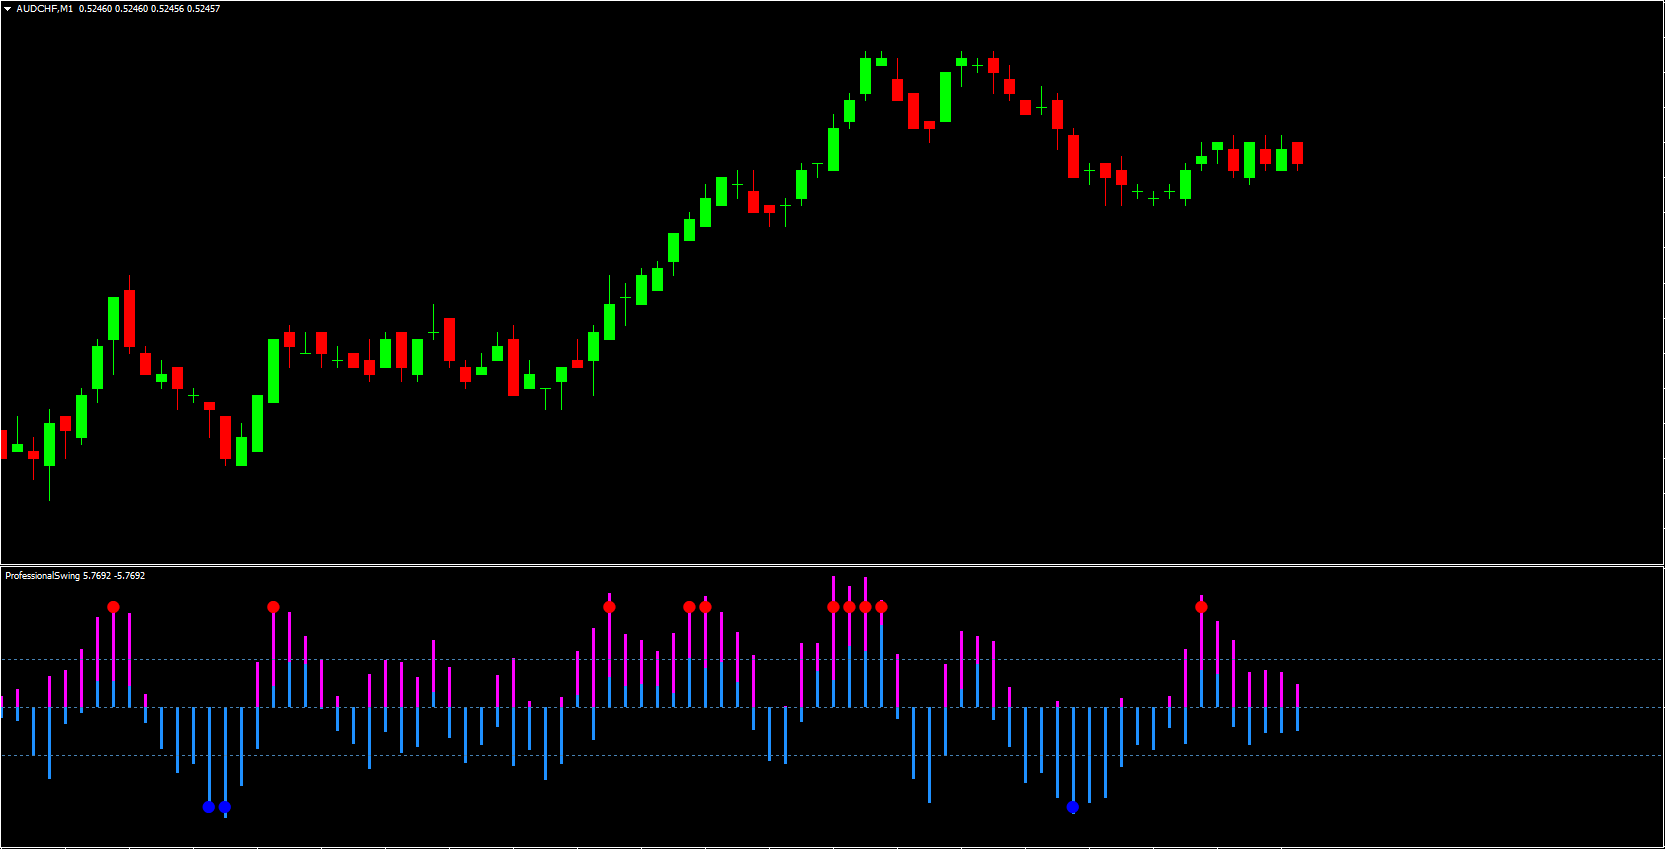
The Professional Swing Indicator is a technical analysis tool designed specifically for MetaTrader 4. It paints purple and blue bars to illustrate market direction:
Purple bars above the zero line = upward momentum
Blue bars below the zero line = downward movement
These visual cues help traders quickly assess trend direction without manually analyzing candle patterns or oscillators.
Importance of the 12-Line Trend Filter
A unique feature of this indicator is its 12-line, which acts as a trend-strength reference point.
Purple bars breaking above the 12-line indicate a strong bullish trend.
Blue bars dropping below the 12-line indicate strong bearish pressure.
This additional filter reduces noise and allows traders to identify more reliable trend signals.
Understanding the BUY and SELL Signal Dots
In addition to bars, the Professional Swing Indicator also plots blue and red signal dots:
Blue dot = SELL signal
Red dot = BUY signal
These dots mark potential market highs and lows, making it easier for traders to identify reversals or continuation setups.
Using Dots as Entry and Exit Points
The dots act as pivot confirmations:
A blue dot plus bars below the 12-line signals an upcoming uptrend, ideal for long entries.
A red dot plus purple bars above the 12-line signals a downtrend, ideal for short entries.
The next opposing dot often serves as a natural exit signal, making trade management clearer and more efficient.
Best Timeframes for the Professional Swing Indicator
Although the indicator works on all MT4 timeframes, it performs best on higher timeframes like:
Daily
Weekly
Lower timeframes may produce noise and false signals, especially for scalpers and day traders.
Combining the Indicator With Other Tools
To improve accuracy, traders often pair the Professional Swing Indicator with:
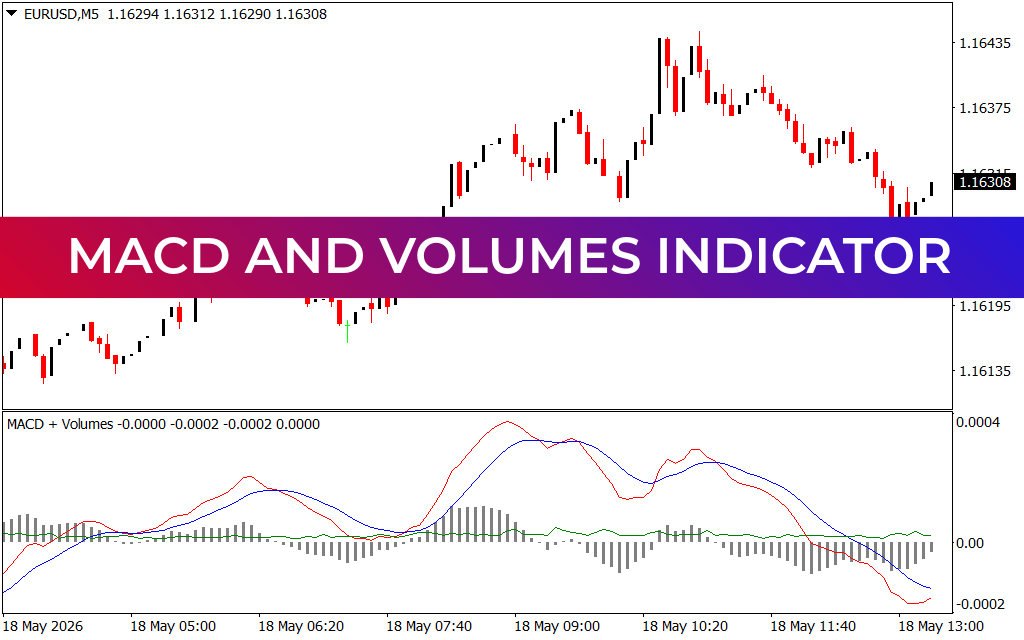
MACD (trend confirmation)
RSI (overbought/oversold validation)
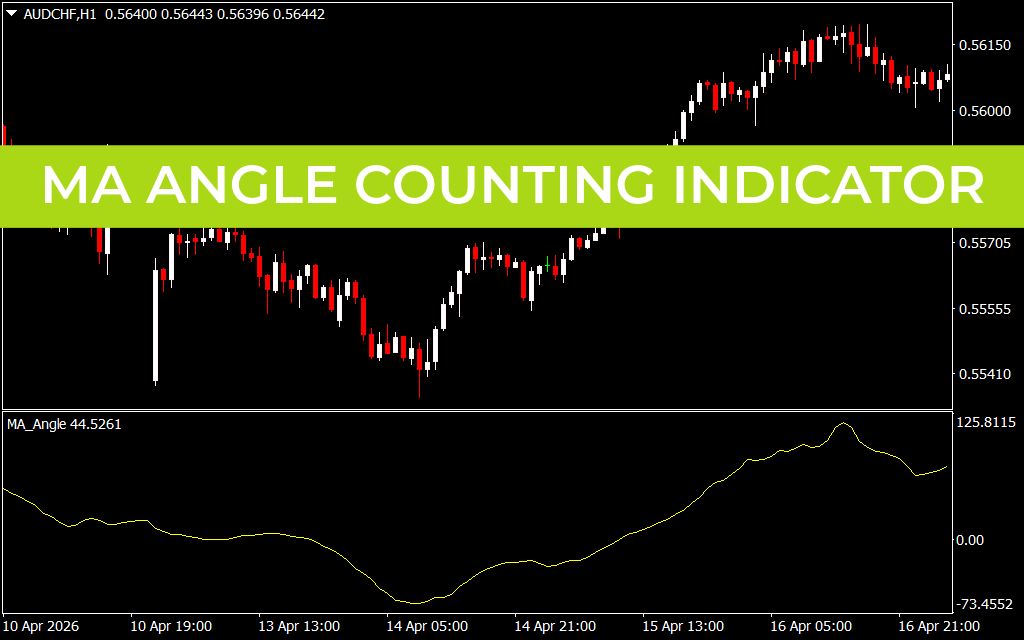
Moving averages
This combination strengthens signal reliability and improves trading decisions.
Practical Example: GBP/USD BUY & SELL Signals
A GBP/USD daily chart illustrates how the indicator marks clear highs and lows. When a blue dot forms with bars below the 12-line, it suggests a bullish reversal. Conversely, a red dot with purple bars above the 12-line signals a bearish reversal. These straightforward visual cues help new and advanced traders monitor potential market turns.
Should You Use the Professional Swing Indicator?
The indicator is ideal for traders who want a simple, visual approach to trend forecasting and signals. It provides:
Clear BUY/SELL signals
Trend Strength visualization
High/low swing points
Easy entry/exit mapping
100% free download availability
For best results, apply it to longer timeframes and combine it with an additional Momentum Indicator.
Conclusion
The Professional Swing Indicator for MT4 is a robust, user-friendly tool that simplifies trend identification and trading signal generation. By integrating colored bars, the 12-line filter, and reversal dots, it helps traders find accurate entry and exit points. Combine it with RSI, MACD, or your preferred strategy to enhance confirmation.
Ready to explore more premium and free trading indicators?
👉 Visit IndicatorForest.com to download tools and boost your trading strategy.
FAQ
Published:
Nov 26, 2025 23:30 PM
Category: