Master Market Structure with the SS Support Resistance V04C NMC Indicator
In the financial markets, price doesn't move randomly; it flows between established zones of Supply And Demand. For traders looking to move beyond simple lagging indicators, understanding market structure is the key to consistent profitability. The SS Support Resistance V04C NMC Indicator is a professional-grade tool for the MetaTrader platform designed to automatically identify and plot these critical "battlegrounds" where big banks and institutions place their orders.
What is the SS Support Resistance V04C NMC?
The SS Support Resistance V04C NMC is a sophisticated technical analysis utility that scans historical price data to find significant turning points. Unlike basic indicators that only look at recent highs and lows, the "NMC" (Next Management Control) version uses a refined algorithm to verify the strength of a level based on how price reacted to it in the past.
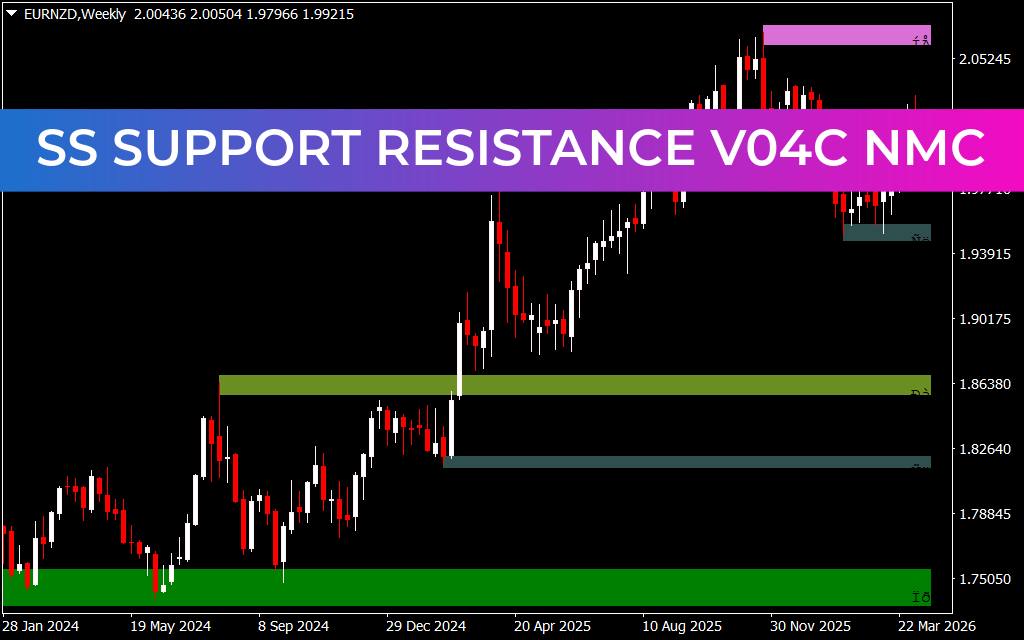
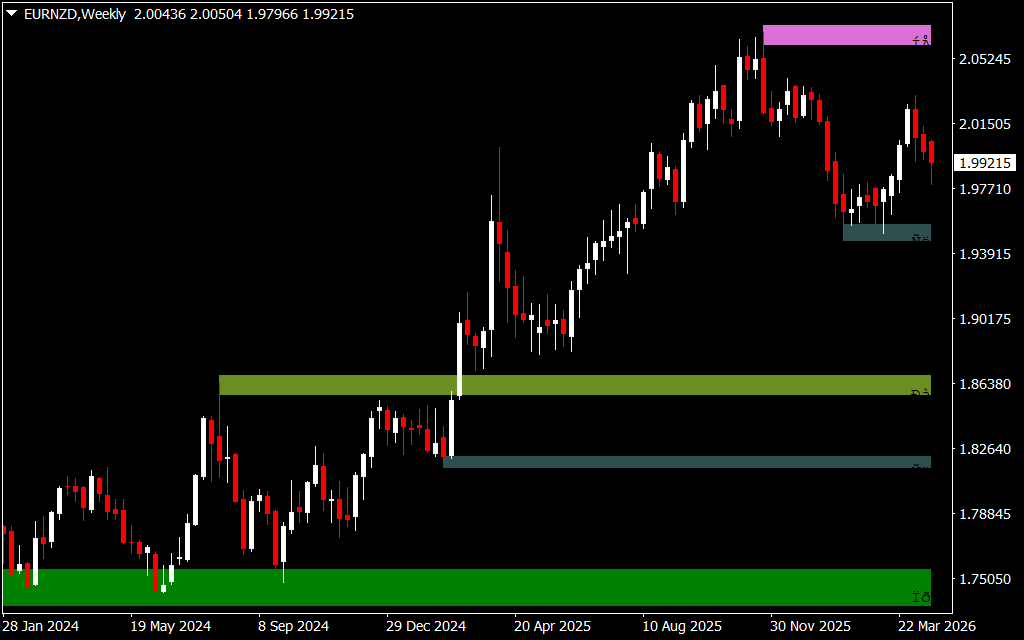
As demonstrated in the EURNZD Weekly chart, the indicator plots clean, horizontal zones across the screen. These zones act as the "floor" (support) and "ceiling" (resistance) of the market. When price approaches these areas, it is mathematically more likely to either stall or undergo a sharp reversal.
Key Features of the V04C NMC Edition
- Automated Zone Detection: Stop second-guessing your chart analysis. The indicator automatically draws high-probability zones, saving you hours of manual charting and removing human subjectivity.
- Institutional Level Weighting: The V04C algorithm distinguishes between "minor" levels and "major" institutional levels. This helps traders focus on the zones that actually have the liquidity to move the market.
- Clean Visual Interface: The indicator is designed to stay out of the way. It uses professional color-coding—typically blue for support and red/purple for resistance—ensuring your charts remain readable and organized.
- Multi-Timeframe Reliability: Whether you are analyzing the Weekly chart for long-term trends or the M15 for intraday entries, the SS Support Resistance tool adapts its sensitivity to provide relevant levels for your timeframe.
Strategic Trading with Support and Resistance
The SS Support Resistance V04C NMC is the foundation of many high-probability trading systems:
- The "Bounce" Trade: Traders wait for price to reach a blue support zone. When a bullish candlestick pattern (like a pin bar) forms inside that zone, it provides a high-confidence entry signal with a tight stop-loss just below the level.
- The Breakout and Retest: When a major resistance zone is finally broken, it often flips and becomes a new support level. The indicator helps you identify these "S/R Flips," allowing you to enter on the retest for a safer, trend-following move.
- Logical Profit Targets: Never wonder where to take profit again. Simply set your targets at the next opposite zone identified by the indicator.
Conclusion
The SS Support Resistance V04C NMC Indicator is an essential asset for any MetaTrader user who values technical precision. By visualizing the invisible structure of the market, it empowers you to trade with the confidence of an institutional participant. Stop trading into "blank space" and start using the levels that the market actually respects.
17 Downloads
Last Update:
Apr 26, 2026 01:55 AM
Published:
Feb 02, 2026 02:39 AM
Category: