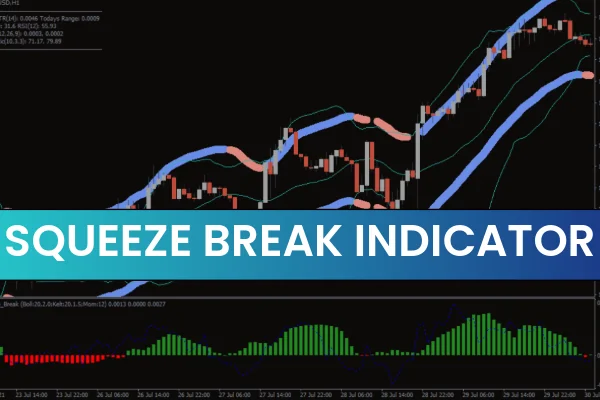
The Squeeze Break Indicator is designed to implement the famous volatility-based trading strategy first mentioned in John Carter’s book “Mastering the Trade.” The strategy revolves around the alternation of trending and flat market phases. By identifying the start of bullish or bearish trends, traders can enter at optimal points and maximize profits.
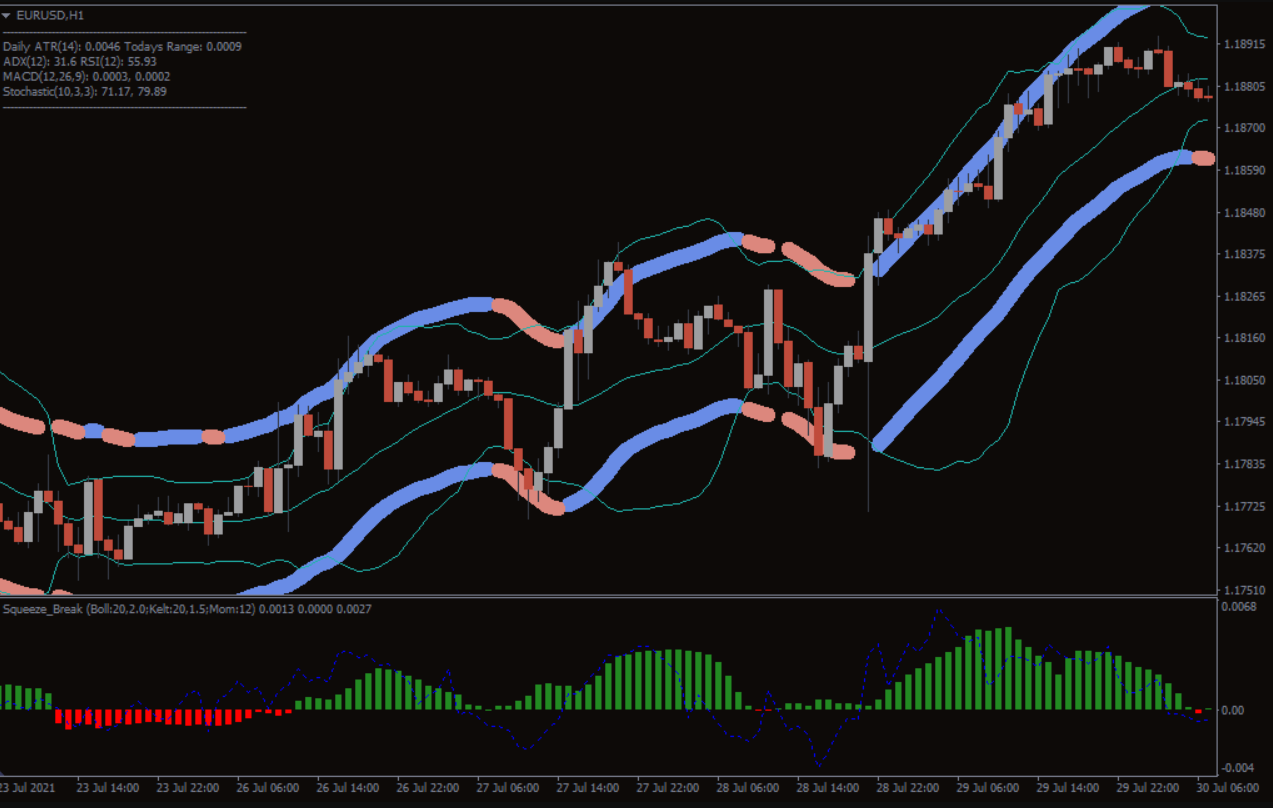
Displayed in a separate window below the price chart, the indicator consists of a red-green histogram and a blue oscillator line that together provide insight into market trends.
How the Squeeze Break Indicator Works
The histogram displays the presence of a trend:
Green bars indicate an active trend.
Red bars indicate a lack of trend (flat market).
The blue line represents the trend direction:
Above zero indicates a bullish trend.
Below zero indicates a bearish trend.
The Squeeze Break indicator is based on the interaction between Bollinger Bands and the Keltner Channel. Bollinger Bands expand and contract with price volatility, while the Keltner Channel reacts differently, allowing the indicator to detect trending and non-trending periods.
When Bollinger Bands are inside the Keltner Channel, the histogram is red, signaling a flat market.
When Bollinger Bands expand beyond the Keltner Channel, the histogram turns green, indicating the start of a trend.
The blue line is essentially a Momentum Indicator, showing the strength and direction of the trend.
How to Trade Using the Squeeze Break Indicator
Buy Signal
Histogram bar turns green.
Blue line is above zero and pointing upward.
Enter a long position.
Hold the position while the trend remains valid, but you can close the trade when the histogram and blue line start showing weakening momentum to secure profits.
Sell Signal
Histogram bar turns green.
Blue line is below zero.
Enter a short position.
Hold the position while the trend persists, closing if signs of trend weakening appear.
By following these rules, traders can enter trending markets early and exit strategically, improving their chance of success.
Key Benefits of the Squeeze Break Indicator
Automated trend detection: Identify bullish and bearish trends instantly.
Customizable settings: Adjust three built-in indicators and display preferences.
Notification system: Get alerts for trend changes.
Historical signal analysis: Review past trends to refine your strategy.
No repainting: Historical signals remain valid for analysis.
Tips to Improve Accuracy
The Squeeze Break indicator is highly effective but may occasionally give false signals due to market noise. Accuracy can be improved by:
Combining Squeeze Break signals with other technical indicators.
Confirming signals across daily and intraday charts.
Considering Support And Resistance zones for trade entry and exit.
Conclusion
The Squeeze Break Indicator for MT4 is a powerful tool for trend trading, providing insights into the start, continuation, and end of trends. With its histogram and oscillator line, it helps traders spot bullish and bearish conditions and take timely action. While no indicator guarantees perfect signals, combining Squeeze Break with proper risk management and other technical tools can improve trading results.
Download the Squeeze Break Indicator for MT4 for free and start identifying high-probability trends in forex, stocks, crypto, and other markets.
FAQ
3 Downloads
Published:
Nov 26, 2025 01:59 AM
Category: