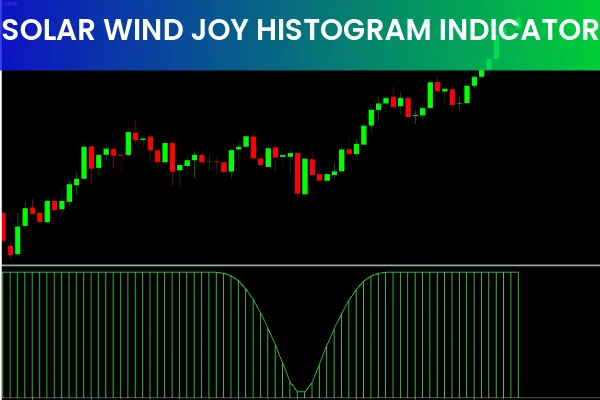
The Solar Wind Joy Histogram Indicator for MT4 is a trend-following technical tool designed to help traders identify market direction and potential reversal zones. Built using advanced algorithms that analyze historical Price Action, the indicator generates dynamic histogram bars that reflect real-time sentiment. This indicator also includes a short golden signal line that highlights potential trend change points. Traders appreciate its simplicity, clarity, and the powerful visual cues that make trend analysis easier—even for beginners.
How the Solar Wind Joy Histogram Indicator Works
The Solar Wind Joy Histogram indicator provides a combination of sentiment and directional bias using three simple visual elements:
Zero Line – defines bullish or bearish bias
Golden Line – signals potential trend shifts
Histogram Bars – represent market sentiment through color
Each component works together to give a clearer overview of trend development, strength, and possible reversals.
Zero Line Trend Bias
The zero line serves as the primary reference point for trend direction:
Price above the zero line indicates a bullish bias
Price below the zero line signals a bearish bias
This simple structure allows traders to quickly assess market conditions and avoid trading against the trend.
Golden Line Reversal Signal
The golden line plays an important role by showing when the trend is potentially losing strength. When the golden line shifts direction or crosses levels where momentum is fading, it may indicate a possible reversal or slowdown in price action.
Lime Green and Red Histogram Bars
The histogram bars visually display market sentiment:
Lime green bars = bullish strength
Red bars = bearish pressure
These bars grow in height when momentum increases, helping traders gauge the strength of current market conditions.
How to Use the Solar Wind Indicator
The Solar Wind Joy Histogram is straightforward, making it suitable for all trading levels. Here’s how to interpret its main signals:
Identify the Trend with the Zero Line
The first step is determining overall market direction:
If bars stay above zero → look for BUY setups
If bars stay below zero → look for SELL setups
This keeps traders aligned with the prevailing trend.
Watch the Golden Line for Trend Change Alerts
The golden line is one of the most valuable features of the Solar Wind indicator. When it changes direction or slope, it suggests that the current trend may weaken. Traders can use this signal to prepare for either entering early or tightening existing positions.
Confirm Sentiment Using Histogram Colors
A combination of a golden line shift and histogram color change provides high-probability setups. For example:
Golden line pointing upward + green bars → potential BUY opportunities
Golden line pointing downward + red bars → potential SELL opportunities
These confirmations help reduce false entries and strengthen decision-making.
How to Trade with the Solar Wind Joy Histogram Indicator
Using the Solar Wind Joy Histogram effectively requires confluence and proper analysis. Here’s a simple step-by-step method:
BUY Setup Example
Histogram bars move above zero
Bars turn lime green
Golden line angles upward
Enter BUY on candle close
Place stop-loss below recent swing low
Exit when bars start shrinking or when golden line weakens
SELL Setup Example
Histogram bars move below zero
Bars turn red
Golden line angles downward
Enter SELL on candle close
Place stop-loss above recent swing high
Exit when bars weaken or golden line shifts direction
Best Practices When Using the Solar Wind Joy Histogram
To strengthen your strategy:
Combine the indicator with support and resistance
Add a moving average for additional confirmation
Avoid trading near major news events
Use proper risk management and target realistic profit areas
Conclusion
The Solar Wind Joy Histogram Indicator for MT4 is a valuable trend-following and reversal-spotting tool that helps traders read momentum clearly. Its histogram bars, golden line, and zero-line structure make it ideal for new and experienced traders alike. To discover more high-quality MT4 tools, visit IndicatorForest.com and expand your trading strategy library.
FAQ
3 Downloads
Published:
Nov 19, 2025 10:38 AM
Category: