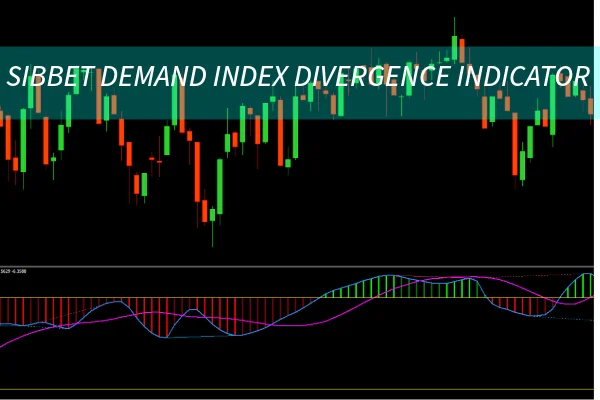
The Sibbet Demand Index Divergence Indicator is a sophisticated trading tool that helps traders detect divergences between price action and the demand index. By spotting these discrepancies early, traders can anticipate potential reversals and fine-tune their trading strategies. At IndicatorForest.com, we explore how this powerful indicator can become a cornerstone of your momentum-based trading system.
The Sibbet Demand Index Divergence Indicator measures the relationship between buying pressure (demand) and price movements. Divergence occurs when these two elements move in opposite directions — a classic warning that a market reversal may be near.
This indicator is especially useful in forex, stocks, and cryptocurrency trading, where momentum shifts can occur rapidly. By interpreting divergence signals, traders can stay ahead of market changes and make informed entry and exit decisions.
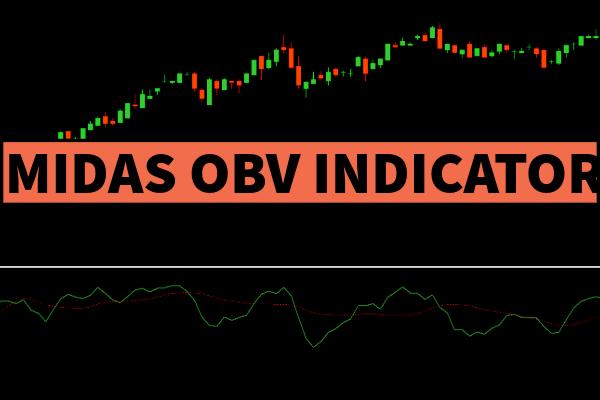
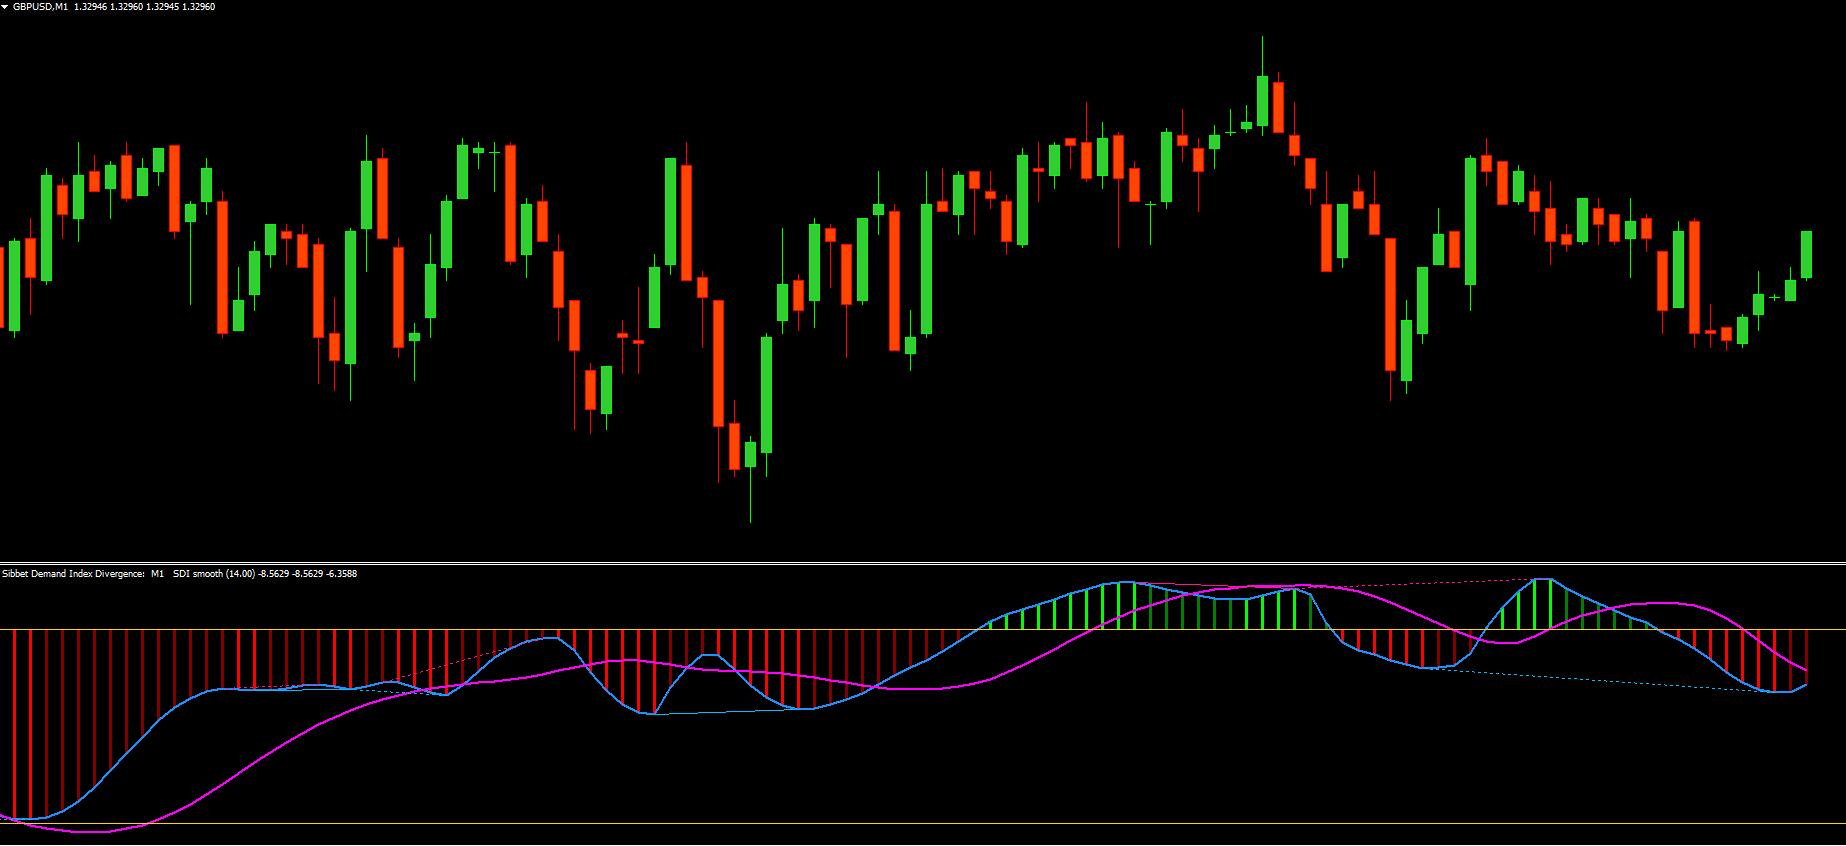
The indicator calculates the demand index by combining price changes with trading volume, resulting in a dynamic oscillator that tracks the flow of market demand. When plotted on a chart, it reveals valuable insights into market strength or weakness.
Bullish Divergence: Occurs when the price forms a lower low while the indicator makes a higher low. This indicates rising demand despite falling prices — a sign that buyers are stepping in.
Bearish Divergence: Happens when the price makes a higher high, but the indicator forms a lower high. This suggests waning demand, signaling that sellers may soon dominate the market.
These divergence patterns help traders anticipate potential reversals and adjust their trading positions before the broader market reacts.
To simplify analysis, the Sibbet Demand Index Divergence Indicator often includes:
Color-coded histogram bars to represent bullish and bearish momentum.
Divergence lines connecting price and indicator peaks or troughs.
Alerts or signals for real-time divergence detection.
Such visual cues make it easier for both novice and professional traders to spot opportunities without performing complex manual analysis.
While the indicator is powerful on its own, combining it with other tools enhances accuracy. Traders often pair it with:
Moving Averages for trend confirmation
Relative Strength Index (RSI) for momentum validation
Candlestick Patterns for precise entry timing
When a bullish or bearish divergence aligns with confirmation from these additional indicators, it strengthens the case for a potential reversal.
Example strategy:
Identify divergence between price and the Sibbet Demand Index.
Confirm with RSI or MACD for trend reversal validation.
Enter trades in the direction of the anticipated reversal.
Use stop-loss orders to manage risk effectively.
Early Reversal Detection: Identifies turning points before price changes become evident.
Improved Timing: Enhances precision in trade entries and exits.
Broad Market Application: Works effectively in forex, stocks, and crypto markets.
Visual Clarity: Simplifies divergence recognition with built-in visual cues.
By integrating this indicator into your trading strategy, you gain deeper insights into market dynamics and improve your ability to capture profitable opportunities.
In forex markets, a bullish divergence between the EUR/USD price and the Sibbet Demand Index often signals an upcoming rally. Conversely, a bearish divergence warns traders of a potential downturn. Recognizing these shifts early helps traders enter positions at optimal points — maximizing potential returns while minimizing risk exposure.
The Sibbet Demand Index Divergence Indicator is a valuable addition to any trader’s toolkit. By leveraging divergence signals, traders can identify early signs of trend reversals and make more precise decisions. Whether you trade short-term price swings or long-term trends, this indicator offers a clear edge in understanding market momentum.
Explore more powerful trading tools and indicator bundles at IndicatorForest.com to enhance your trading strategy today.
Published:
Oct 09, 2025 14:22 PM
Category: