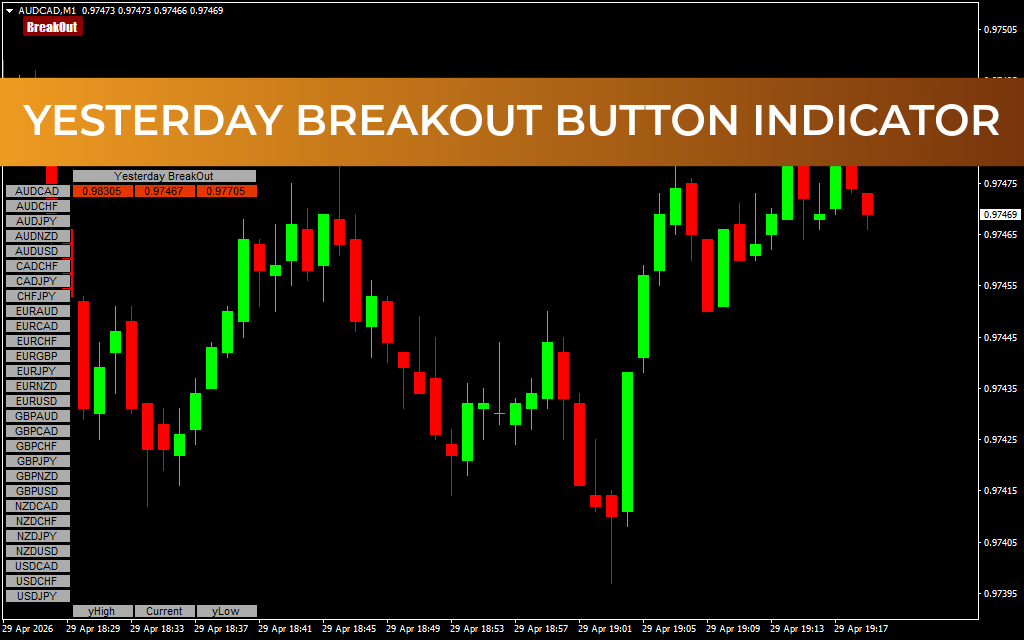
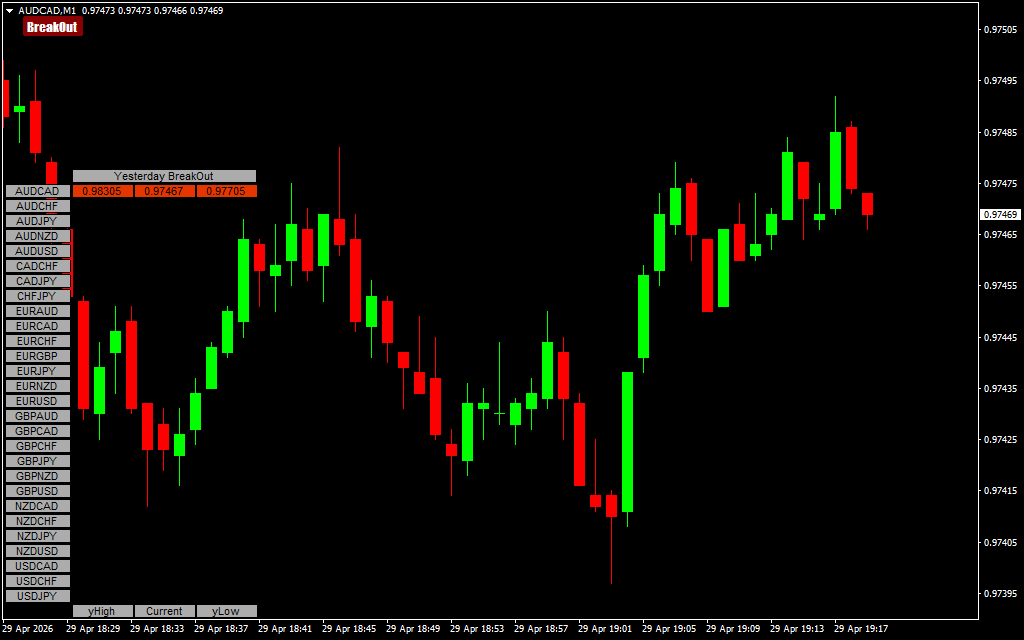
Capture Market Momentum with the Yesterday Breakout Button Indicator
The previous day's high and low are two of the most critical psychological levels in technical analysis. Institutional traders, algorithms, and retail players all watch these levels to gauge market sentiment and volatility. The Yesterday Breakout Button Indicator is a streamlined, professional-grade tool for MetaTrader designed to highlight these levels and provide instant alerts when a breakout occurs.
What is the Yesterday Breakout Button Indicator?
The Yesterday Breakout Button Indicator is a specialized utility that automatically identifies and draws the high and low price levels from the previous trading day. Unlike static indicators that clutter your chart, this tool often features a unique "one-click" toggle button, allowing traders to show or hide the levels instantly to keep their workspace clean.
When the price breaks above yesterday's high, it signifies a strong bullish breakout; when it drops below yesterday's low, a bearish breakout is confirmed. For day traders and scalpers, these "Yesterday High/Low" (YHL) levels serve as the ultimate line in the sand, dictating whether they should be looking for Trend Continuation or a mean-reversion trade.
Key Features of the Yesterday Breakout Indicator
- Automatic Level Calculation: No more manual drawing. The indicator calculates the exact high and low of the previous session across any currency pair or asset class.
- Interactive Toggle Button: Features a user-friendly button on the chart interface to enable or disable the visual lines, ensuring a distraction-free trading environment.
- Smart Alert System: Receive real-time push notifications, email alerts, or sound cues the moment the price breaches a breakout level.
- Customizable Timeframes: While essential for M1 and M5 intraday traders, the indicator works seamlessly on all timeframes, adapting to the previous day’s data regardless of your current view.
Trading Strategy: The Power of the Breakout
The most successful ways to use the Yesterday Breakout Button Indicator involve identifying the "intent" of the market participants at these key zones:
- The Trend Continuation: If the market opens above yesterday's close and breaks the Yesterday High (YH) with high volume, it suggests strong buying pressure. Traders can enter a "Buy" position with a stop-loss just inside the YH line.
- The False Breakout (Fakeout): Often, the price will poke above yesterday’s high only to reverse sharply. If the indicator signals a breakout but the price fails to sustain it, this creates a high-probability "Sell" setup as the market returns to its previous range.
- Support into Resistance: Once yesterday's low is broken, that level often flips and becomes a new resistance zone. Traders can use the indicator to find "retest" entries for short positions.
Why Every Intraday Trader Needs This Tool
Price Action is driven by memory, and yesterday’s price range is the most recent memory the market holds. The Yesterday Breakout Button Indicator takes the guesswork out of identifying these pivot points. By automating the process and providing a clean, interactive interface, it allows you to focus on execution rather than chart maintenance.
2 Downloads
Last Update:
Apr 29, 2026 22:21 PM
Published:
Oct 24, 2025 22:38 PM
Category: