Trading with Volume: The Power of the Midas OBV Indicator
In the world of technical analysis, price is often considered the primary signal, but volume is the fuel that drives it. The Midas OBV Indicator (On-Balance Volume) is a sophisticated tool designed to bridge the gap between Price Action and market participation. By tracking the flow of volume, this indicator helps traders identify whether "smart money" is accumulating or distributing an asset, providing a significant edge in predicting future price breakouts.
What is the Midas OBV Indicator?
The Midas OBV is an advanced iteration of the classic On-Balance Volume Momentum Indicator. It calculates a running total of trading volume to show whether money is flowing into or out of a security. When the closing price is higher than the previous close, all of the day's volume is considered "up-volume." When the closing price is lower, all of the day's volume is considered "down-volume."
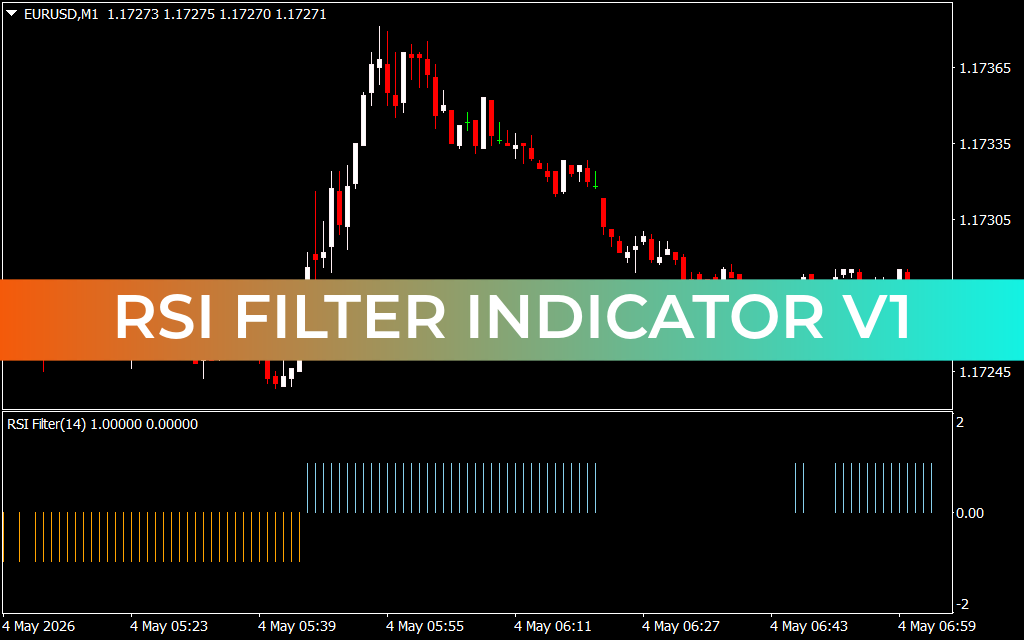
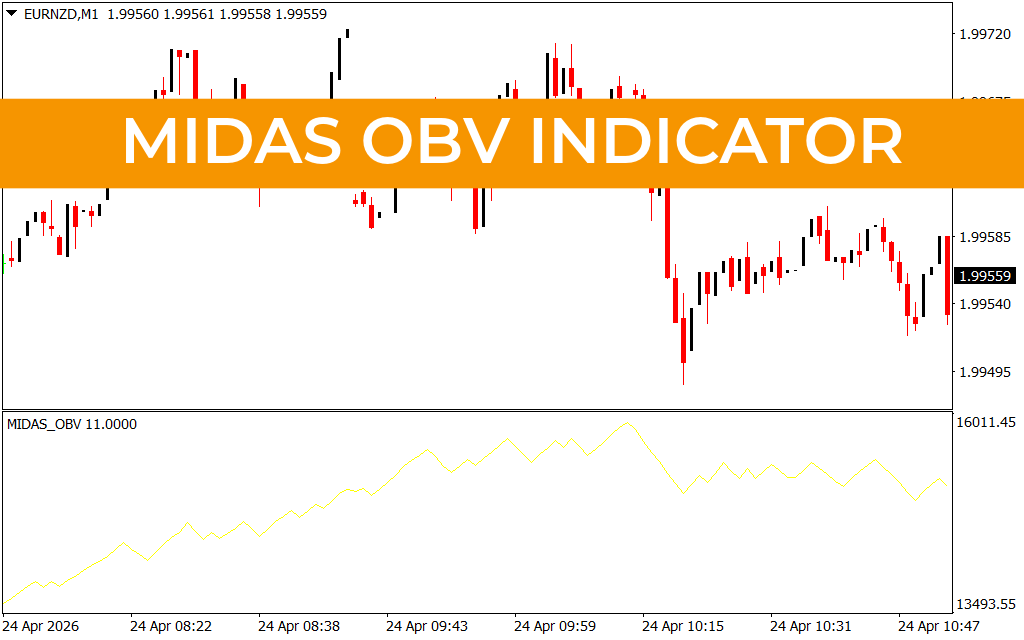
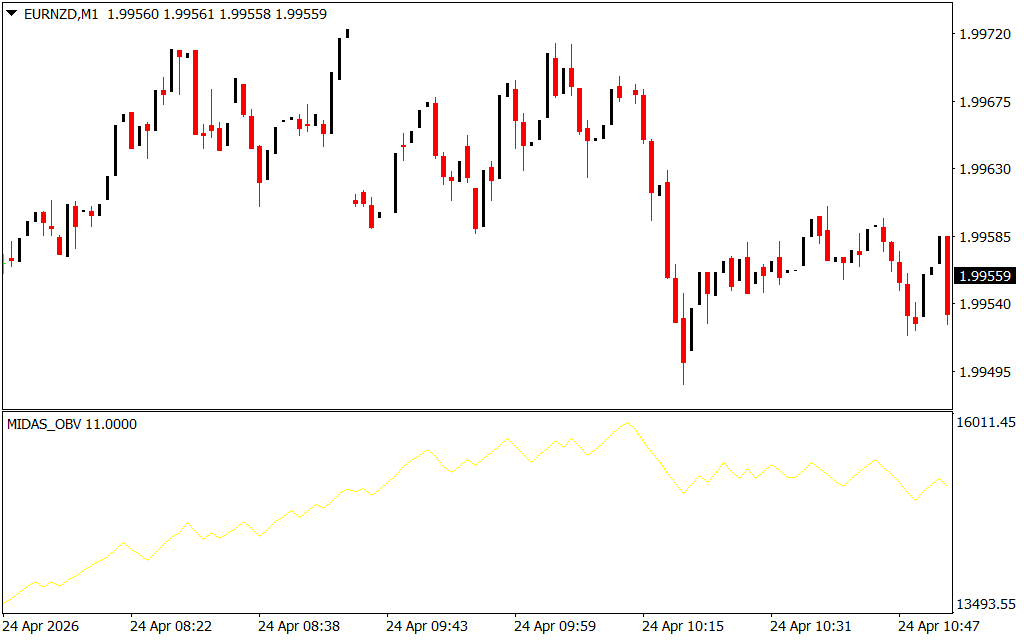
As shown in the EURNZD M1 chart, the Midas OBV appears as a continuous yellow line in a separate sub-window. Unlike price charts which can be filled with erratic wicks and "fakeouts," the Midas OBV provides a smoother representation of market pressure, making it an essential tool for trend traders and scalpers alike.
Why Volume Analysis Matters
Most retail traders fail because they ignore the underlying strength of a move. The Midas OBV reveals the truth behind the candles:
- Trend Confirmation: If price is rising and the Midas OBV line is also rising, it confirms a healthy uptrend supported by strong buying volume.
- Early Reversal Warnings: One of the most powerful features of the Midas OBV is its ability to spot Divergence. If the price reaches a new high but the OBV line fails to do so, it suggests that fewer buyers are participating in the move, indicating an imminent bearish reversal.
- Breakout Validation: When price is stuck in a consolidation range, a sudden spike in the Midas OBV often precedes a price breakout. This allows traders to position themselves before the major move occurs.
How to Trade with Midas OBV
The Midas OBV is most effective when used to identify "accumulation" and "distribution" phases. In the provided M1 chart, we can see the OBV line steadily climbing even during minor price retracements. This indicates that buyers are absorbing the selling pressure, leading to the eventual bullish continuation.
Traders should look for Breakouts in the OBV line itself. Often, the OBV line will break a resistance level before the price does. This "leading signal" is the holy grail for day traders looking to enter high-probability setups with tight stop-losses. By combining the Midas OBV with standard price action tools like Support And Resistance, you can create a robust trading system that accounts for both price and power.
2 Downloads
Last Update:
Apr 24, 2026 15:20 PM
Published:
Feb 03, 2026 12:29 PM
Category: