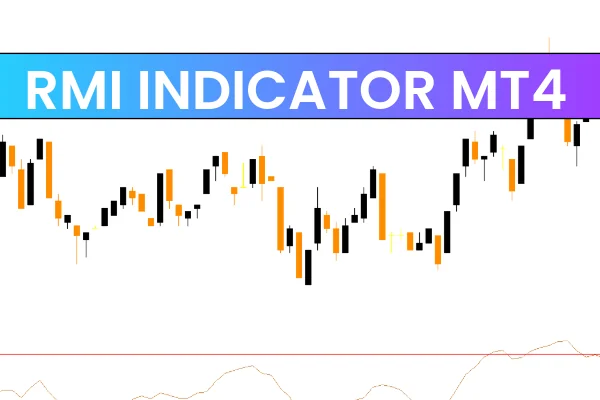
The RMI Indicator for MT4, also known as the Relative Momentum Index, is a modernized and more responsive variation of the classic RSI (Relative Strength Index). While the RSI calculates strength using price changes between consecutive candles, the RMI uses momentum over a chosen period, making it more accurate, smoother, and better at identifying overbought and oversold market conditions.

Because of its enhanced responsiveness, traders can apply nearly all RSI-based strategies while gaining additional benefits such as pattern detection and stronger divergence signals. This makes the RMI a versatile choice for intraday, swing, and long-term traders.
What Is the RMI Indicator for MT4?
The RMI Indicator for MT4 is an oscillator that moves between 0 and 100, helping traders identify potential price reversals, trend exhaustion, and high-probability entry zones. It also has the ability to automatically detect:
Overbought levels
Oversold levels
Bullish and bearish divergences
Double tops and double bottoms
Head and shoulders formations
These extra features make the RMI one of the most versatile momentum indicators in MetaTrader 4.
How the RMI Indicator Works
Unlike RSI, which relies on the difference between two consecutive candles, the RMI incorporates momentum across multiple periods, giving it:
Smoother oscillation
Less noise
Faster reaction to emerging trends
Better momentum structure detection
This increased sensitivity helps traders enter trades earlier without relying solely on Price Action.
The indicator works efficiently across:
M1, M5, M15 intraday charts
H1–H4 swing trading setups
Daily, weekly, and monthly charts
Both beginners and advanced forex traders use RMI due to its simplicity and accuracy.
RMI Indicator for MT4 Trading Signals
Overbought & Oversold Signals
The RMI typically uses 70 as overbought and 30 as oversold.
Sell Setup (Overbought Reversal)
RMI moves above 70 → market is overbought
Wait for the RMI to cross back below 70
Place SELL
Stop loss: above previous swing high
Exit: when an opposite signal appears
Buy Setup (Oversold Reversal)
RMI dips below 30 → market is oversold
Wait for the RMI to cross above 30
Place BUY
Stop loss: below previous swing low
Exit: at the opposite signal
This strategy is ideal for both Scalping and swing trading.
Pattern-Based Trading (Double Tops, Double Bottoms, H&S)
The RMI automatically displays patterns within the oscillator window, such as:
Double top
Double bottom
Head and shoulders
These formations often appear before price reverses, giving traders a leading warning.
This allows early entries with strong confluence.
Divergence Trading Strategy
Divergence occurs when price and RMI move in opposite directions.
Bullish Divergence: Price makes lower lows, RMI makes higher lows → Buy
Bearish Divergence: Price makes higher highs, RMI makes lower highs → Sell
Divergence is one of the most reliable reversal signals, helping traders position themselves ahead of trend changes.
Advantages of the RMI Indicator for MT4
More responsive than RSI
Detects additional technical patterns
Ideal for all timeframes
Multi-strategy usage (reversals, trends, divergences)
Easy for beginners, powerful for advanced traders
Works on all forex pairs, metals, indices, crypto
Free to download and install
Conclusion
The RMI Indicator for MT4 is one of the best alternatives to the traditional RSI. It offers increased responsiveness, better accuracy, and additional features like divergence detection and pattern recognition. Traders familiar with RSI will instantly feel comfortable using RMI, while also enjoying its enhanced performance.
If you're looking to boost your technical trading strategy, the RMI indicator is a must-have tool.
For more MT4/MT5 indicators, guides, and free downloads, visit IndicatorForest.com.
FAQ
1 Download
Published:
Nov 17, 2025 08:17 AM
Category: