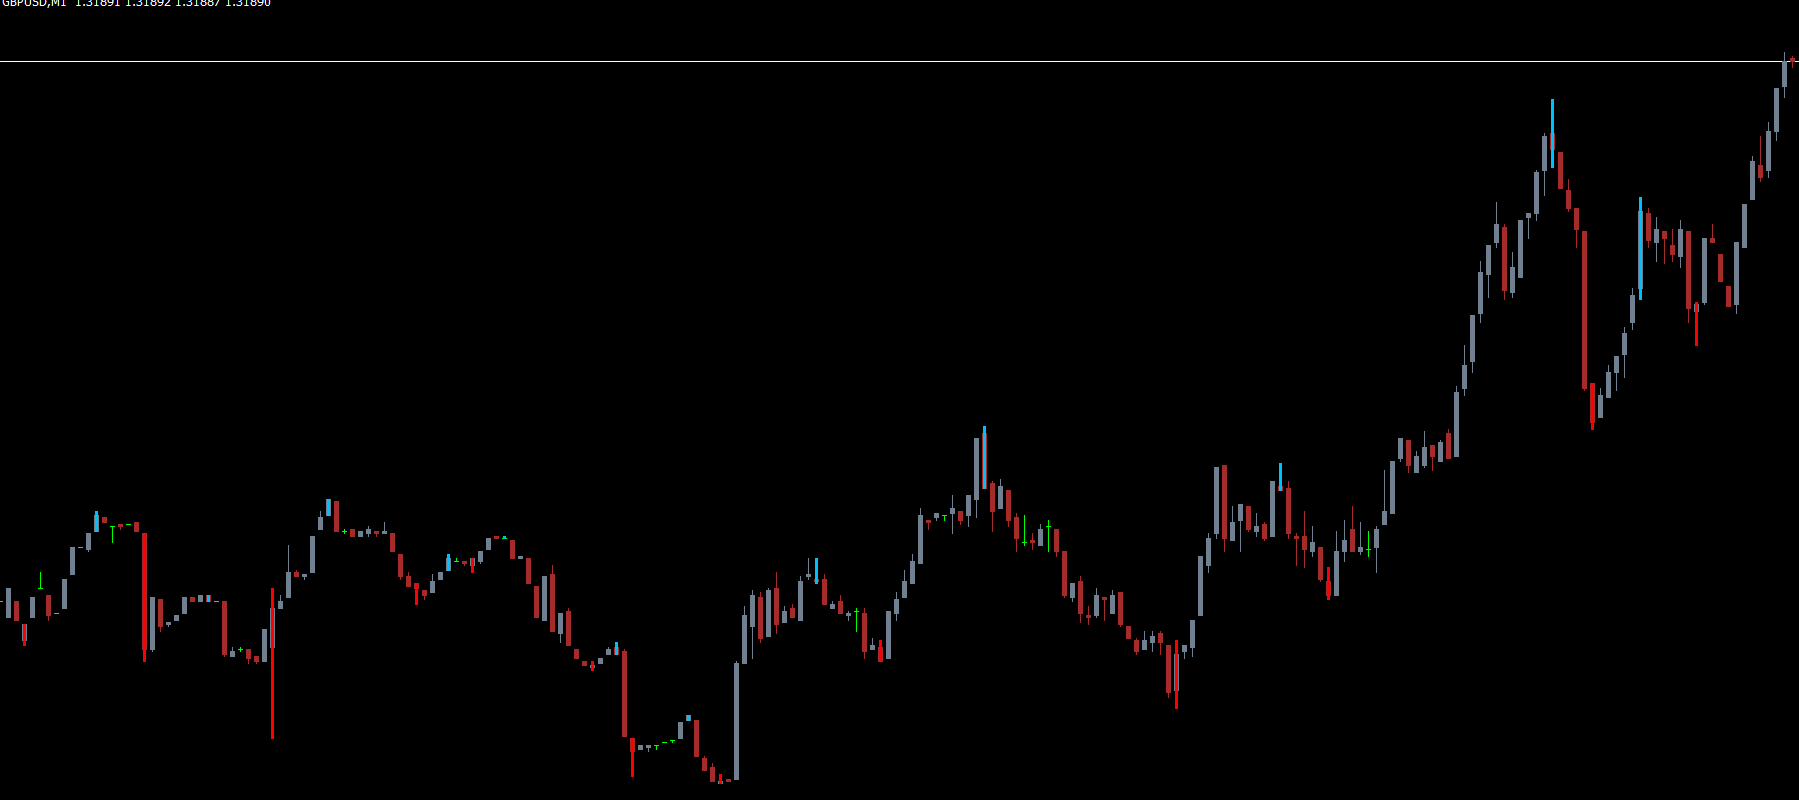
The Reversal Bar Indicator for MT4 is a powerful forex tool designed to detect potential turning points in the market. It highlights new highs and lows within a trend by plotting special bars that signal when a retracement may be ending. These bars appear in sky blue during bullish setups and red during bearish setups, making them easy to spot even for beginner traders.
Because it is a non-repaint indicator, traders can trust that once a signal forms, it will not disappear later. This reliability makes it suitable for Trend Continuation, counter-trend strategies, and precise entry timing across different market conditions.
How the Reversal Bar Indicator Works
The tool identifies specific price structures that indicate exhaustion in a retracement. When the market pulls back during a trend, the indicator analyzes whether the Price Action is losing momentum and then paints a colored reversal bar at the new swing point.
Sky Blue Reversal Bars
Sky blue bars represent bullish reversal opportunities, often appearing at the low of a retracement within an uptrend. They indicate that buyers may be regaining control.
Red Reversal Bars
Red bars represent bearish reversal opportunities, usually forming at the high of a retracement within a downtrend. These signal that sellers may step back in.
The simplicity of its design makes it ideal for traders of all levels. The tool does not clutter the chart and works seamlessly alongside other MT4 indicators.
Why Use the Reversal Bar Indicator?
This indicator is beneficial for several reasons:
Non-repaint signals for reliable decision-making
Highlights precise entry zones based on market structure
Works in all market conditions and across all MT4 timeframes
Useful for trend traders and counter-trend traders
Perfect for Scalping, intraday, day trading, and swing trading
Helps identify end of retracements, which is often the safest entry point
Whether you trade currency pairs, indices, or commodities, this indicator helps refine your strategy and improve your timing.
How to Trade Using the Reversal Bar Indicator
Determine the Market Trend
Before taking any trade, identify whether the market is trending upward or downward. You can do this by using trendlines, a moving average, or price structure analysis.
Wait for the Indicator to Print a Reversal Bar
Once the trend direction is clear:
In an uptrend, wait for a sky blue bar to appear at the retracement low.
In a downtrend, wait for a red bar to appear at the retracement high.
These bars indicate that the pullback may be ending.
Confirm With Price Breakout
A BUY setup is confirmed when the price breaks above the sky blue reversal bar.
A SELL setup is confirmed when the price breaks below the red reversal bar.
This breakout adds confluence and reduces false signals.
Combine With Technical Analysis
While the indicator is effective on its own, combining it with:
RSI (for overbought/oversold)
MACD (for momentum shifts)
Trendlines or channels
Candle patterns
can significantly improve accuracy and reduce risk.
Reversal Bar Indicator for Different Trading Styles
The indicator adapts well to multiple trading strategies:
Scalping
Quick reversals on M1–M5 timeframes.
Day Trading
High-accuracy setups during intraday retracements.
Swing Trading
Reliable signals at major market turning points.
Because the indicator highlights exhaustion at retracement extremes, it aligns perfectly with smart-money style pullback entries.
Conclusion
The Reversal Bar Indicator for MT4 is an effective, non-repaint tool for identifying potential price reversals at new highs or lows. It is especially useful for finding optimal entry zones after retracements in both uptrends and downtrends. Traders can easily integrate it with other indicators for improved accuracy.
You can download the Reversal Bar Indicator for free from IndicatorForest.com and explore more MT4 tools to enhance your trading performance.
FAQ
7 Downloads
Published:
Nov 25, 2025 21:15 PM
Category: