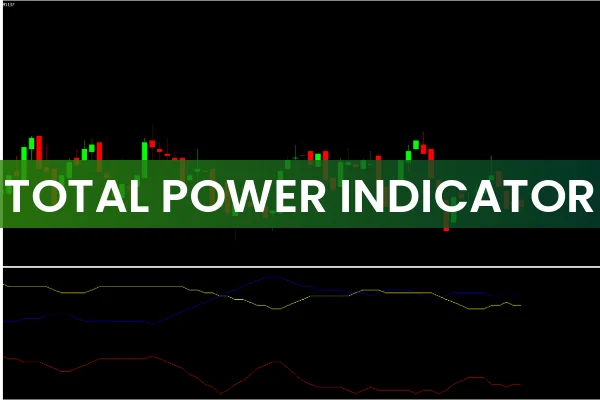
The Total Power Indicator for MT4 is a powerful forex trading tool designed to measure the relative strength of bulls and bears in the market. Built with a 13-day Exponential Moving Average (EMA) and a specialized algorithm, this indicator helps traders determine whether buyers (bulls) or sellers (bears) dominate the market at any given time.
By analyzing past price data in relation to current market movements, the Total Power Indicator MT4 provides valuable insights into trend direction, potential reversals, and overall market momentum. It is suitable for Scalping, day trading, and swing trading, making it a versatile tool for both beginner and experienced traders.
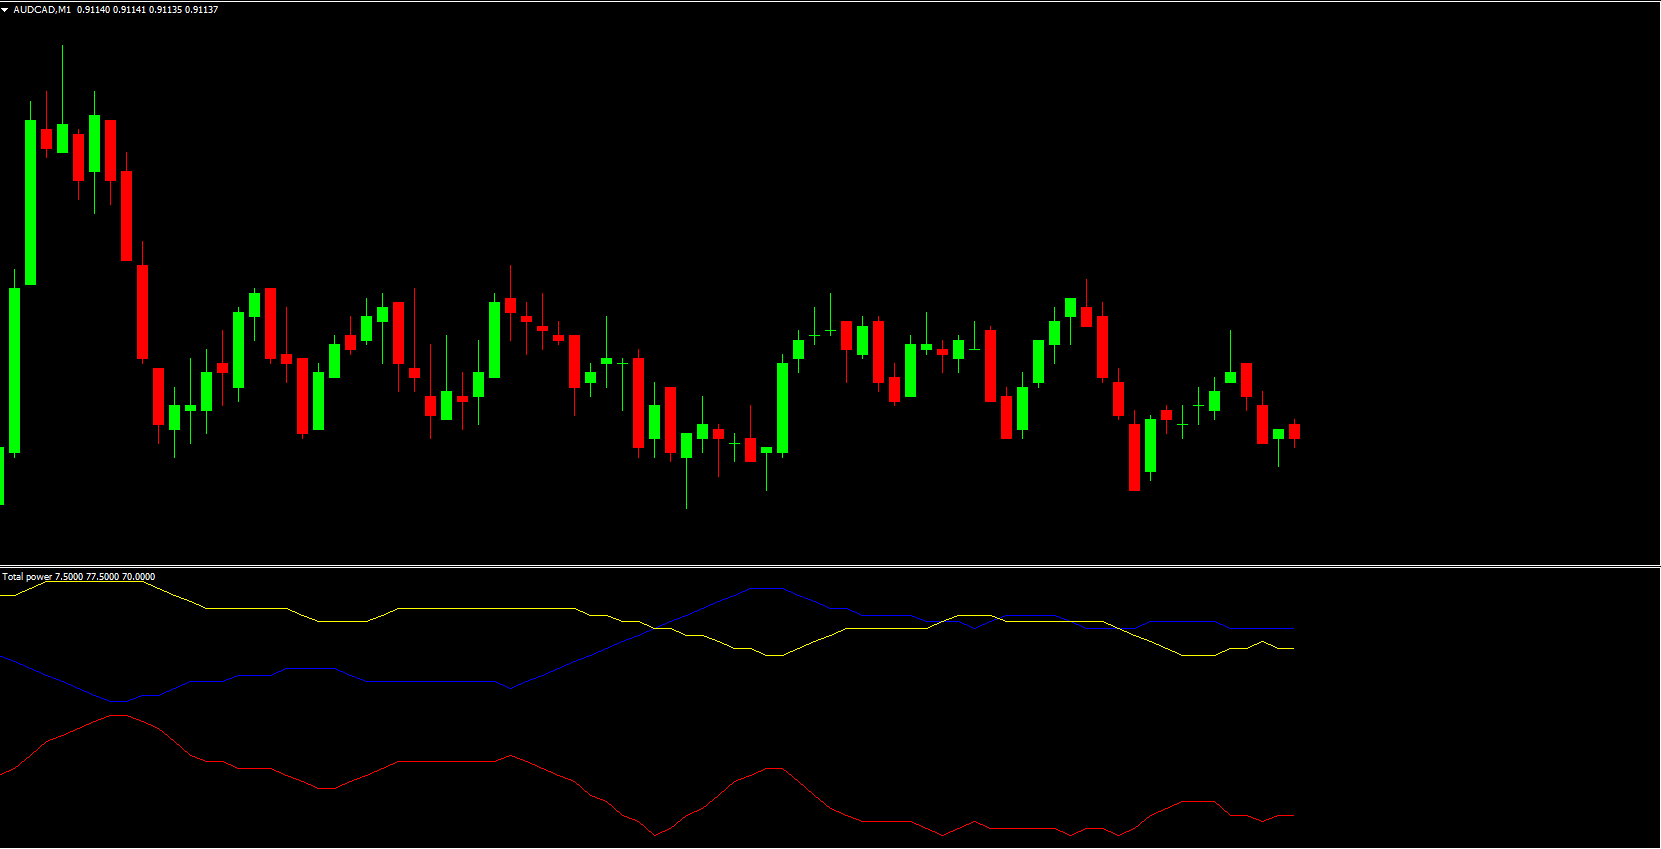
How the Total Power Indicator Works
The indicator consists of three main lines:
Yellow Line (Bull Power): Represents the strength of buyers in the market.
Red Line (Bear Power): Indicates the power of sellers or bearish pressure.
Blue Line (Total Power): Reflects the overall Trend Strength combining both bull and bear data.
These lines interact dynamically to depict the market’s internal power structure, helping traders spot emerging trends or fading momentum early.
How to Use the Total Power Indicator MT4
The Total Power Indicator generates trading signals based on the crossovers of its colored lines. Here’s how to interpret them:
Bullish Signal: When the yellow line (bull power) crosses above the red line (bear power) from below, it signals a potential bullish move.
Bearish Signal: When the red line (bear power) crosses above the yellow line (bull power), it signals a potential bearish trend.
Trend Strength Confirmation: When both lines intersect above the 50-level, it indicates a strong bullish or bearish trend depending on the direction of the crossover.
This indicator is often used alongside Price Action and candlestick patterns for higher accuracy. For example, a bullish crossover supported by a bullish engulfing candle increases the reliability of a buy signal.
How to Trade With the Total Power Indicator
In a typical setup, traders should:
Identify the crossover between the yellow and red lines.
Confirm the signal with trend direction from the blue total power line.
Enter a buy trade when the yellow line crosses above the red line and price action supports the move.
Enter a sell trade when the red line crosses above the yellow line.
For example, on an H4 chart of EURUSD, a crossover of the yellow line above the red line often signals a bullish move. When this move is supported by bullish candlestick formations, traders can confirm a potential entry point.
Advantages of the Total Power Indicator MT4
Trend Identification: Quickly identifies market direction based on bull/bear dominance.
Reversal Detection: Detects early trend reversals with crossover signals.
Multi-Time Frame Compatibility: Works well on M15, H1, H4, and Daily charts.
Easy to Use: Visual color-coded signals make it beginner-friendly.
Free Tool: Available for download on IndicatorForest.com.
Conclusion
The Total Power Indicator for MT4 is an advanced yet easy-to-use forex trading indicator that measures the strength of bulls and bears to reveal market trends and reversals. It’s ideal for traders looking to enhance their technical analysis with precise momentum insights.
Whether you trade short-term or long-term, this indicator helps you stay aligned with the dominant market force. To download the Total Power Indicator MT4 and explore other free forex tools, visit IndicatorForest.com.
FAQ
Published:
Nov 09, 2025 04:30 AM
Category: