The EMA to SMA MACD Indicator for MT4 is a custom technical analysis tool that merges two of the most effective moving average systems—Exponential Moving Average (EMA) and Simple Moving Average (SMA)—to identify accurate trend direction and trading signals.
This hybrid version of the classic MACD (Moving Average Convergence Divergence) indicator offers enhanced precision by incorporating both EMA and SMA-based momentum signals, making it ideal for traders who prefer reliable confirmation before entering or exiting trades.
👉 Download the EMA to SMA MACD Indicator free from IndicatorForest.com and start improving your trade timing and trend accuracy today.
How EMA to SMA MACD Indicator Works
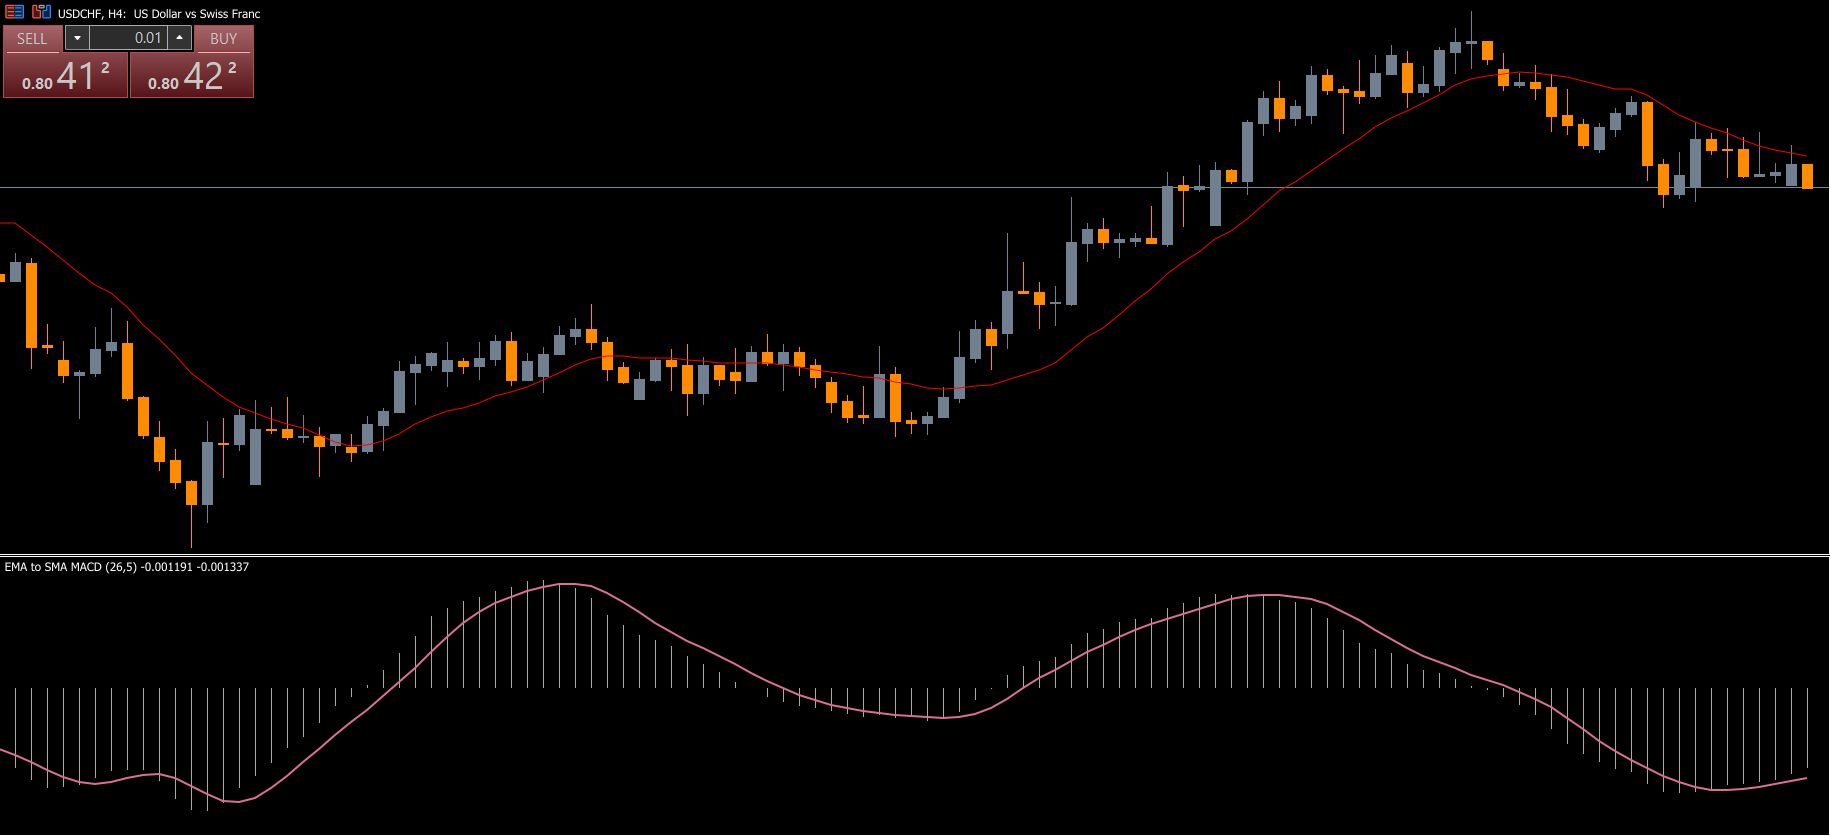
The EMA to SMA MACD combines the power of two moving averages with the traditional MACD signal line and histogram to evaluate market momentum and price strength.
Components of the Indicator:
EMA (Exponential Moving Average): Reacts faster to price changes and identifies short-term momentum shifts.
SMA (Simple Moving Average): Smooths out volatility and provides a stable long-term trend signal.
MACD Signal Line: Generated by subtracting one moving average from another to produce actionable BUY/SELL signals.
Histogram: Displays the difference between the MACD line and the signal line, showing momentum direction and strength.
When the MACD histogram rises above zero, it indicates bullish pressure. Conversely, when the histogram dips below zero, it signals bearish sentiment.
EMA to SMA MACD Indicator Trading Strategy
The EUR/USD H1 chart example shows how traders can interpret BUY and SELL signals generated by this indicator.
Buy Signal
The histogram moves from below to above the zero line.
The bars rise above the MACD signal line, confirming bullish momentum.
The EMA line crosses the SMA line upward, showing a Trend Reversal.
Entry Tip: Enter a BUY position once the crossover confirms, setting a stop-loss below the recent swing low.
Sell Signal
The histogram starts forming bars above zero that begin to shrink.
The MACD bars drop below the signal line, signaling weakening bullish momentum.
The EMA line crosses below the SMA line, confirming a downtrend.
How to Improve Accuracy
While the indicator performs well on all chart timeframes, it’s recommended to use it on H1, H4, or Daily charts to reduce false signals.
For stronger confirmation:
Combine it with support/resistance zones or the Joker Filter Indicator for MT4.
Check volume indicators to confirm breakout strength.
Use trendlines or Fibonacci retracement to spot entry levels.
FAQs About EMA and MACD
Does MACD use EMA or SMA?
The EMA to SMA MACD Indicator uses both moving averages simultaneously to calculate the signal line, blending fast and slow momentum dynamics for better precision.
Are EMA and MACD the same?
No. The EMA is a standalone moving average line, while the MACD combines moving averages and a histogram to measure convergence and divergence between them.
Conclusion
The EMA to SMA MACD Indicator for MT4 is an essential tool for traders who value accuracy and reliability in momentum-based trading. By merging two powerful moving averages, it provides clear BUY and SELL signals, identifies potential trend reversals, and helps filter out market noise.
It’s perfect for traders who use trend-following or swing trading strategies and want a deeper understanding of market momentum.
Download the EMA to SMA MACD Indicator for MT4 free now from IndicatorForest.com and enhance your trading analysis today.
FAQ
Published:
Nov 11, 2025 00:25 AM
Category: