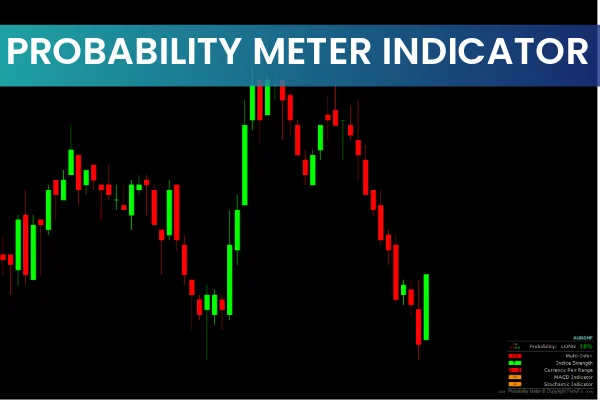
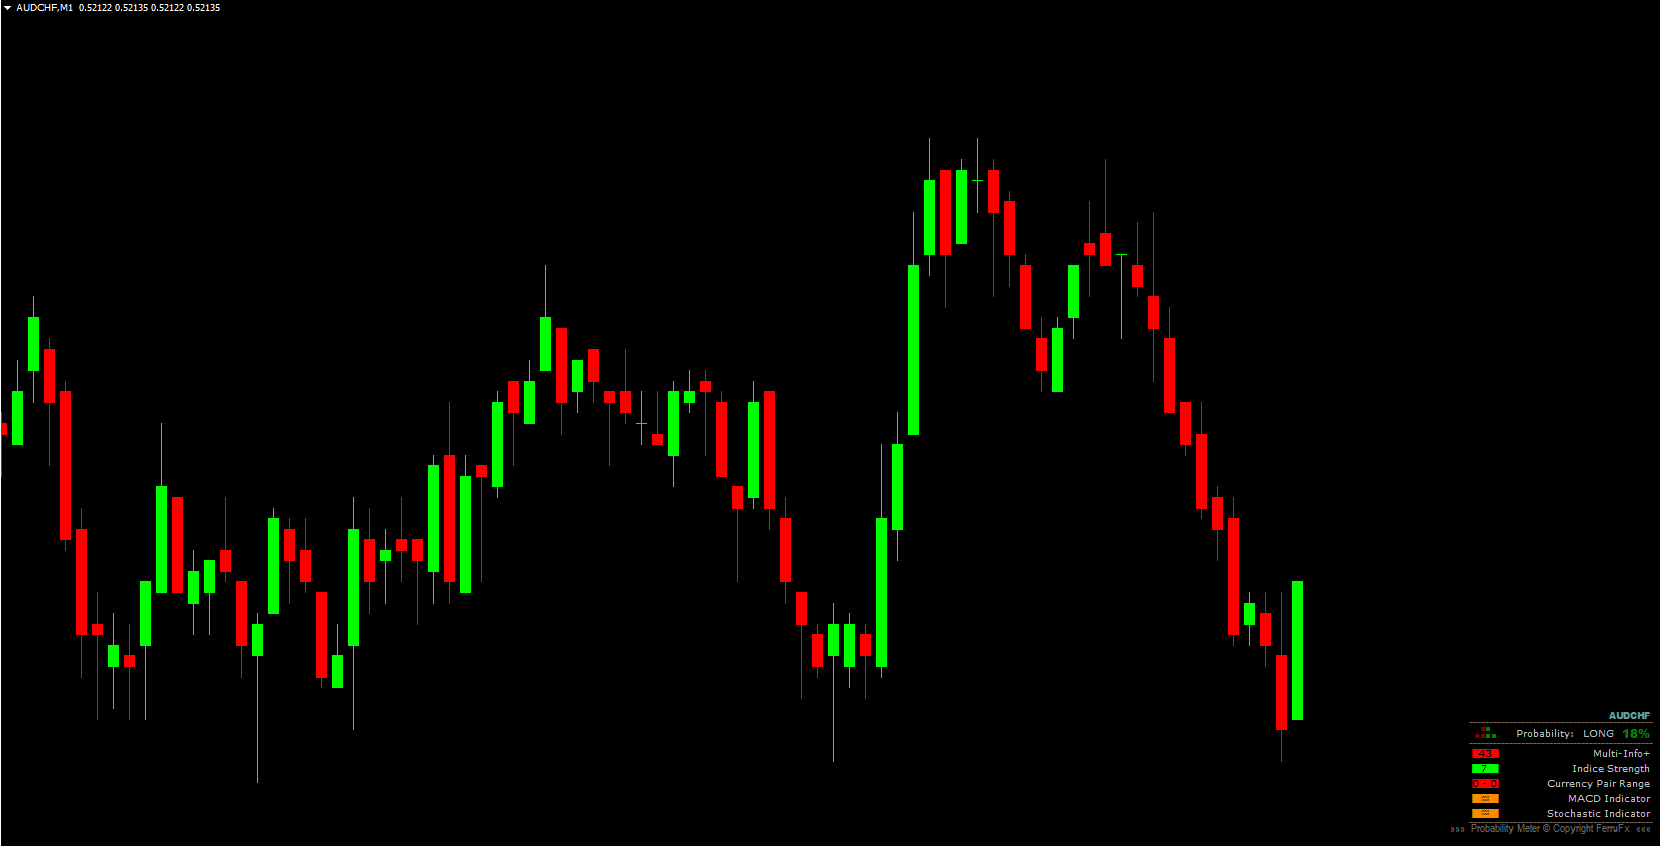
The Probability Meter Indicator is a unique trading tool designed to highlight high-probability market conditions. Its primary purpose is to combine multiple technical indicators and timeframe data into a single, easy-to-read percentage value. Instead of analyzing several charts or interpreting complex drawings, traders receive a simple numerical output that reflects the likelihood of price direction. This makes the probability meter highly suitable for both beginners and experienced traders who want a straightforward sentiment-based tool.
At its core, the indicator uses a powerful calculation method that blends data from 13 built-in indicators across seven timeframes. To enhance customization, traders can also add two additional indicators of their choice. This multi-layered approach helps generate a “global percentage” that represents the probability of an uptrend or downtrend.
Why Traders Use the Probability Meter Indicator
Many indicators require interpretation, pattern recognition, or a combination of settings. The Probability Meter Indicator removes this complexity. There are no moving averages to compare, no oscillators to interpret, and no chart clutter to distract you. Instead, the indicator produces:
A probability percentage for the current price direction
Color-coded signals, which help identify buy or sell zones instantly
Additional values such as multi info+, which give deeper insight into overall market strength
Thanks to its real-time data feed and multi-timeframe integration, the Probability Meter is ideal for short-term trading, including Scalping and intraday strategies.
How to Read Probability Meter Signals
Clear, Easy-to-Interpret Output
One of the biggest strengths of the Probability Meter Indicator is its simplicity. Traders only need to read two main data points:
Probability Percentage – Indicates the likelihood of an uptrend or downtrend
Multi Info+ Value – A supporting metric that strengthens the signal
Both values are color coded, making signal interpretation quick and intuitive.
Buy Signals
A strong buy signal appears when:
The probability percentage indicates bullish direction
The multi info+ value is green
The multi info+ value is above 75
When these conditions align, the indicator suggests favorable bullish conditions suitable for long positions.
Sell Signals
Conversely, a sell signal appears when:
The probability percentage shifts bearish
The multi info+ turns red or negative
Readings drop significantly below the bullish threshold
These values clearly indicate potential selling pressure and downward market strength.
Probability Meter Trading Example
Imagine the indicator shows a 55% probability of an uptrend. This already reflects a moderate bullish bias. But a stronger signal comes from the multi info+ reading. If the multi info+ shows a value of 85 and is highlighted in green, this confirms that market conditions are strongly supportive of buying.
In this scenario, a trader would likely open a long position, as both key metrics—probability and multi info+—align to confirm bullish strength.
This dual-confirmation method helps traders avoid false signals and provides a more robust and reliable decision-making framework.
Conclusion
The Probability Meter Indicator simplifies trading by offering direct, high-probability buy and sell signals. Instead of analyzing multiple indicators separately, traders get a consolidated, easy-to-read assessment of market direction. By focusing on the probability percentage and multi info+ values, you can confidently identify strong entry points.
However, as with all indicators, it works best when combined with a complementary confirmation tool or your existing trading strategy. The Probability Meter remains one of the most convenient and powerful tools for traders seeking clear and straightforward signals.
For more advanced trading indicators and tools, visit IndicatorForest.com and discover our complete library.
FAQ
13 Downloads
Published:
Nov 22, 2025 08:20 AM
Category: