One of the most powerful and time-tested tools in technical analysis is the Fibonacci Retracement. Based on the Fibonacci sequence (0, 1, 1, 2, 3, 5, 8, 13, and so on), this mathematical concept helps traders identify potential retracement and continuation zones in trending markets.
However, manually plotting Fibonacci levels can be both time-consuming and error-prone, especially for beginners unsure of where to anchor their highs and lows.
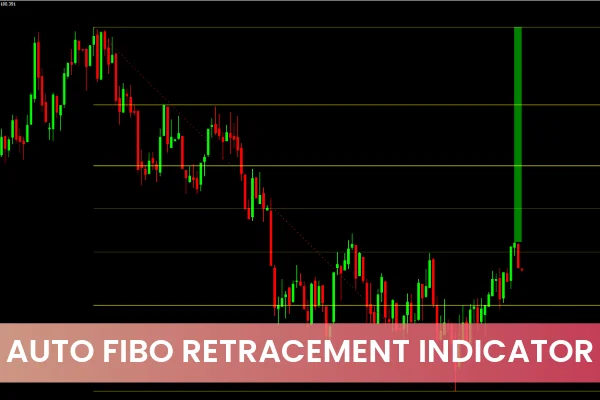
That’s where the Auto Fibonacci Retracement Indicator for MT4 comes in — it automatically identifies key swing points and plots the Fibonacci levels for you, saving time and increasing accuracy.
What Is the Auto Fibonacci Retracement Indicator?
The Auto Fibonacci Retracement Indicator for MT4 iNs an intelligent, automated tool that scans market data to detect the most relevant swing highs and swing lows. It then draws the Fibonacci retracement grid automatically, helping you identify potential pullback levels, reversals, and continuation zones.
With no manual setup required, this indicator ensures your Fibonacci levels are always aligned with real-time Market Structure.
How the Auto Fibonacci Retracement Indicator Works
Once added to your MT4 chart, the indicator automatically:
Detects the most recent high and low of the trend.
Plots Fibonacci levels between 0% and 100%.
Dynamically updates levels as the market evolves and new swing points form.
Example:
If the market is in a bullish trend, the 0% level will appear at the swing low and 100% at the swing high.
If the market is bearish, the positions are reversed — 0% on top and 100% at the bottom.
These levels act as zones of interest where traders anticipate potential retracements or reversals:
38.2% – Moderate pullback zone
50.0% – Common retracement level where short-term traders take profits
61.8% – The “golden ratio” and one of the most powerful reversal zones
78.6% – Deep retracement level often preceding sharp reversals
Example Trading Strategy
Let’s assume the price is in an uptrend and has just made a new high.
If you expect a retracement to occur:
Wait for the price to pull back to the 38.2% or 50% Fibonacci level.
Once you see rejection at one of these zones (for example, via a bullish candlestick pattern), open a BUY trade.
Place your Stop Loss below the swing low or 61.8% level.
Set your Take Profit at the next high or the 0% level.
In the case of a downtrend, reverse the process — look for SELL setups when price retraces upward toward key Fibonacci levels.
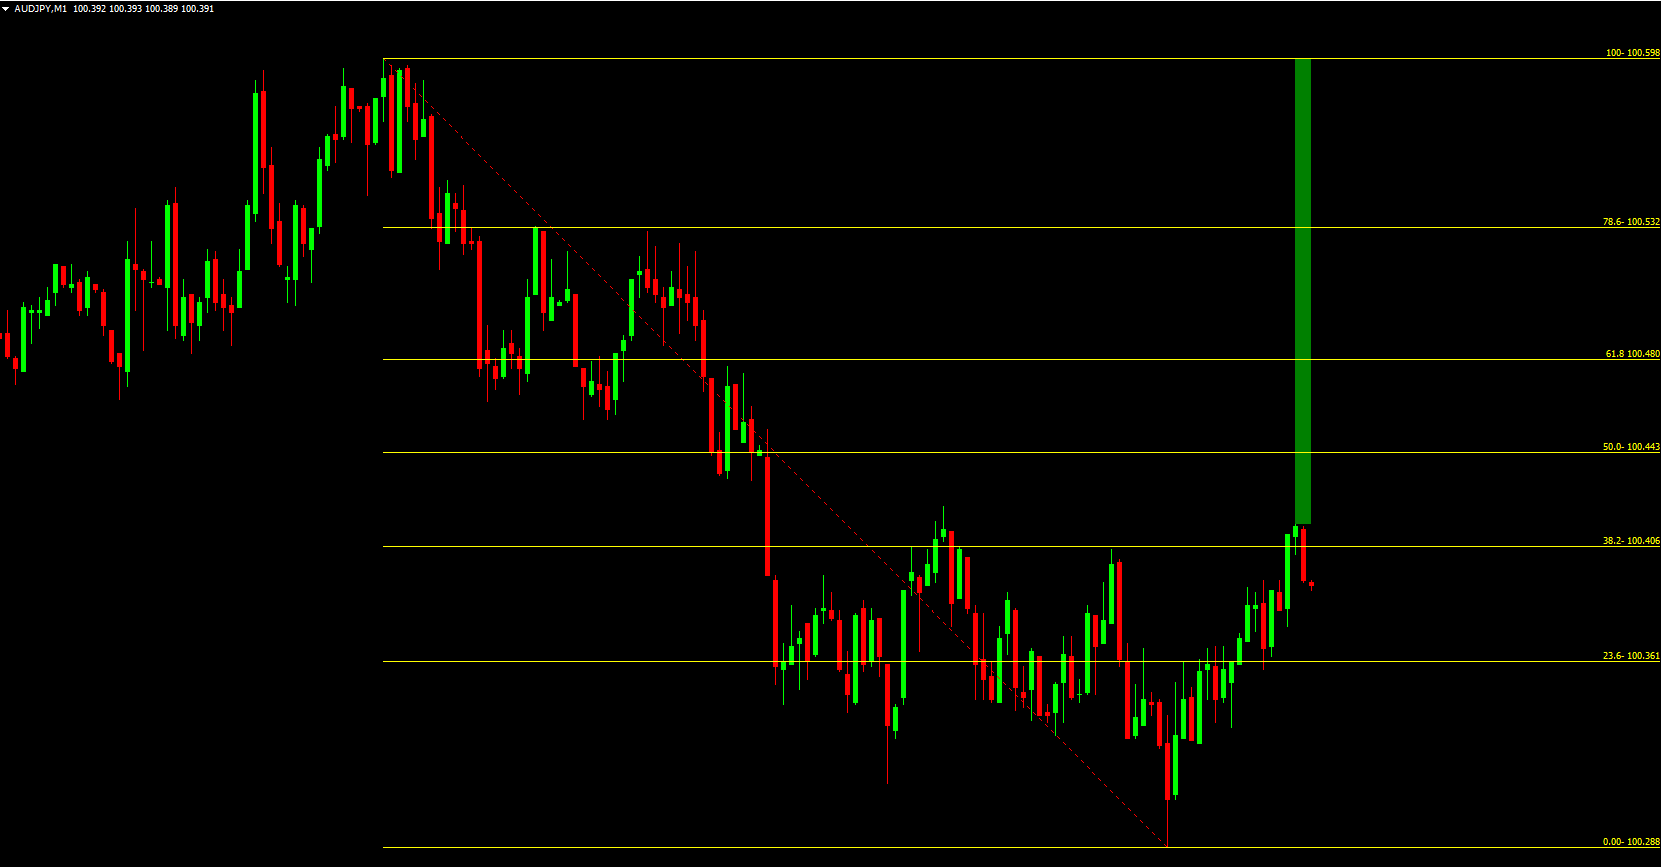
Real-World Example
On the USD/JPY M30 chart, the Auto Fibonacci Retracement Indicator detected a strong uptrend. The retracement went past the 38.2% and 50% levels, but at 61.8%, the market found solid support and reversed back up, resuming its bullish trend.
This is a perfect example of how the indicator identifies high-probability reaction zones where traders can plan entries, exits, and risk levels with confidence.
Why Traders Love the Auto Fibonacci Indicator
Fully Automatic: No need to manually draw or adjust the Fibonacci grid.
Accurate Swing Detection: Identifies valid swing highs/lows with precision.
Multi-Timeframe Support: Works seamlessly on any timeframe — M1 to MN.
Universal Compatibility: Ideal for all currency pairs, indices, and commodities.
Perfect for Confluence: Combine with support/resistance, moving averages, or candlestick patterns.
Pros and Cons
Pros
Automatically identifies and draws Fibonacci retracements.
Works across all timeframes and market instruments.
Excellent for Trend Continuation and pullback strategies.
Minimal setup — beginner-friendly.
Dynamically updates in real time as the market evolves.
Cons
Does not generate standalone buy/sell signals.
Multiple fib zones on volatile charts can appear cluttered.
Works best when combined with other confirmation tools.
Tips for Using the Auto Fibonacci Retracement Indicator
Combine with Price Action:
Fibonacci levels are most powerful when they align with visible support/resistance zones or candlestick patterns (pin bars, engulfing candles, etc.).
Use for Take-Profit Levels:
Even if you don’t use fibs for entries, the levels are ideal for exit planning — for instance, taking partial profits at the 61.8% retracement level.
Avoid Overlapping Grids:
Stick to the most recent impulse leg to prevent visual clutter.
Conclusion
The Auto Fibonacci Retracement Indicator for MT4 is a must-have for traders who use Fibonacci analysis. It saves time, reduces manual errors, and ensures your retracement levels are always accurate and up to date.
Although it doesn’t generate direct buy/sell alerts, it’s an invaluable companion for trend traders and pullback strategists. Combine it with price action or moving averages for high-probability setups.
From personal testing, this tool delivers speed, accuracy, and clarity — letting you focus on decision-making, not manual charting.
Download the Auto Fibonacci Retracement Indicator for MT4 for Free at IndicatorForest.com
FAQ
5 Downloads
Published:
Nov 10, 2025 12:11 PM
Category: