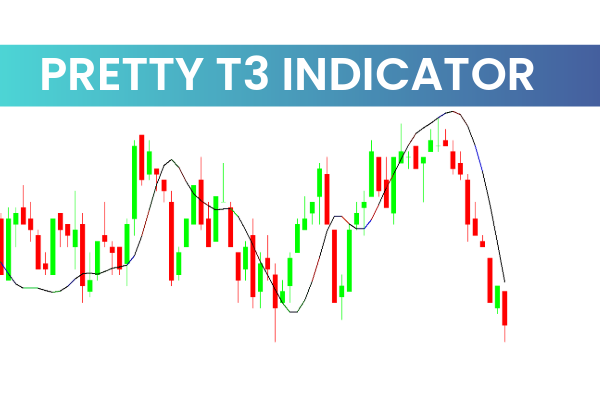
The Pretty T3 Indicator is a widely trusted trend-following tool for MT4, known for offering clear, real-time trend signals. For beginners and experienced traders alike, the Pretty T3 Indicator simplifies market analysis by displaying easy-to-read buy and sell signals on multi-timeframe charts. Because the Pretty T3 Indicator reacts smoothly to market movements, it helps traders understand trend direction without the complexity of advanced indicators.
What Makes the Pretty T3 Indicator Unique?
Technically, the Pretty T3 uses a 7-period Tilson moving average, a more refined version of traditional moving averages. This smoothing technique reduces noise while reacting efficiently to price shifts, making it ideal for trend identification.
Best Timeframes for Trading
During backtesting, the Pretty T3 Indicator showed its strongest performance on:
H1 (Hourly)
H4 (Four-hour)
Daily charts
These timeframes provide the most consistent signals for both day traders and swing traders. Traders seeking simultaneous intraday and multi-session signals in forex or stocks will find this tool particularly practical.
How the Pretty T3 Indicator Generates Buy & Sell Signals
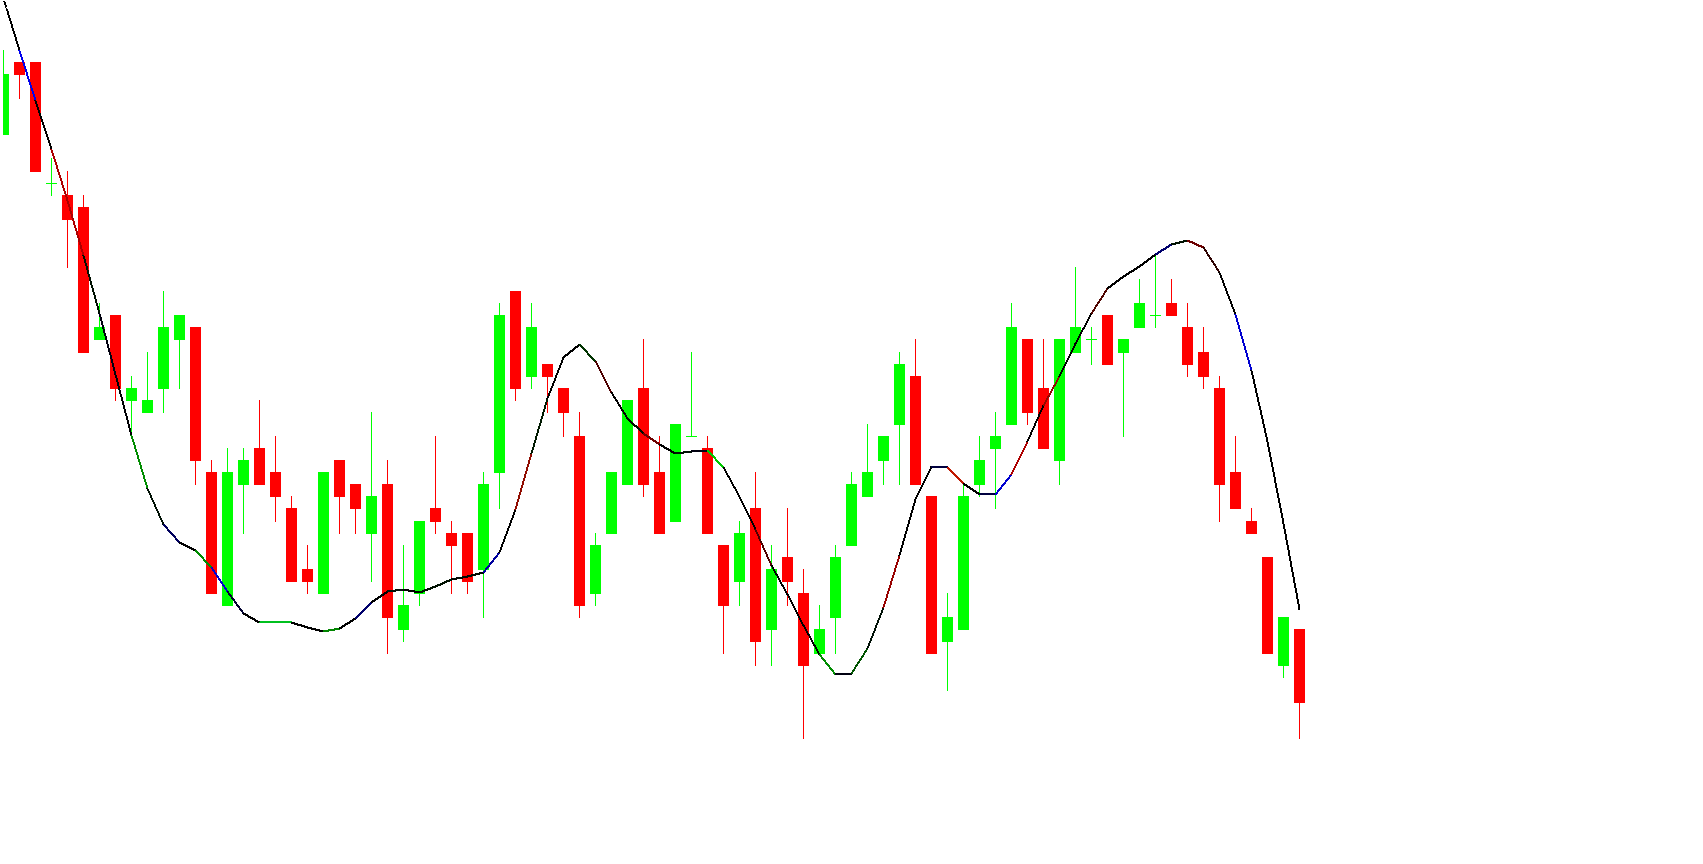
The indicator uses color changes on its T3 signal line to identify shifts in market sentiment:
Blue Line = Bullish Trend
Red Line = Bearish Trend
When the line changes color, the indicator suggests a fresh directional bias in the market.
Using the T3 as Dynamic Support & Resistance
One of the strengths of the Pretty T3 Indicator is its ability to act as a dynamic support or resistance level. Price often reacts at the T3 line during active trends. This makes it easier for traders to plan pullback entries rather than chase price.
How to Trade Forex & Stocks with the Pretty T3 Indicator
To understand how to execute trades using this indicator, follow these basic rules:
Bearish (Sell) Strategy
Wait for the T3 line to turn red, indicating a downtrend.
Allow the price to retrace back toward the T3 line.
Look for a bearish candlestick pattern (e.g., bearish engulfing, pin bar).
Enter a sell order as momentum returns to the downside.
This approach helps traders avoid false entries and ensures alignment with the trend.
Bullish (Buy) Strategy
Confirm that the T3 line has turned blue, signaling a bullish environment.
Monitor for a price pullback to the indicator line.
Wait for bullish candlestick confirmation (e.g., bullish pin bar, engulfing pattern).
Enter a buy trade once the trend resumes upward.
For example, if the market forms a bullish pin bar rejecting the T3 line after the indicator turns blue, it confirms that the bulls are regaining control.
When to Avoid Trading with the Pretty T3 Indicator
The Pretty T3 performs best during clean, directional markets. Traders should avoid taking signals when:
The market is consolidating
Price is moving erratically
Volatility surges without clear structure
Waiting for clear T3 color shifts and pullbacks increases accuracy significantly.
Final Thoughts
The Pretty T3 Indicator is a reliable MT4 trend-analysis tool that helps traders capture trending opportunities with clarity and simplicity. Its color-coded signals, dynamic support/resistance behavior, and suitability for higher timeframes make it a powerful ally for trend-following traders. For the best results, focus on trading during established trends and wait for proper Price Action confirmations.
For more MT4 indicators and expert trading tools, visit IndicatorForest.com
FAQ
3 Downloads
Published:
Nov 20, 2025 23:05 PM
Category: