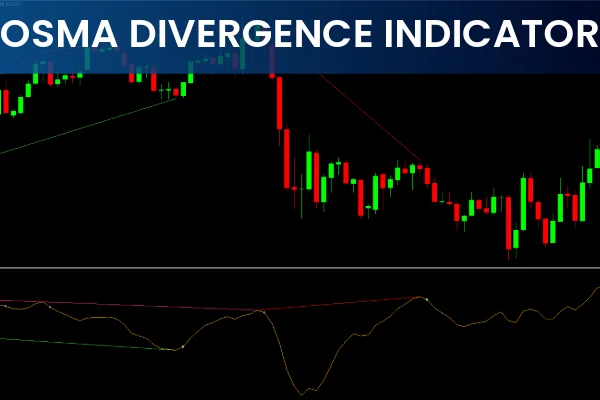
The OsMA Divergence Indicator is a powerful tool that helps traders detect early trend-reversal and trend-continuation opportunities. The OsMA indicator, or Moving Average of Oscillator, is closely related to the MACD and shows the difference between the MACD histogram and its signal line. Many traders use OsMA divergences to improve market timing, and using an automated divergence indicator can simplify the entire process. In this guide, we explain how OsMA works, how divergences form, and how to apply them in real trading.
How the OsMA Indicator Works
The OsMA (Moving Average of Oscillator) is included in the MetaTrader 4 platform by default. It represents the difference between the MACD histogram and its signal line. Because it reacts to momentum changes, traders use it to identify slowing trends, potential reversals, and continuation patterns.
While the classic OsMA and MACD tools are fully functional, enhanced versions—such as automated OsMA divergence indicators—offer additional benefits like visual alerts, historical testing, and automatic divergence marking.
What Is OsMA?
OsMA stands for Moving Average of Oscillator. It is a smoother, more visually intuitive form of momentum tracking compared to the traditional MACD. The OsMA histogram plots momentum waves that rise and fall with price movement.
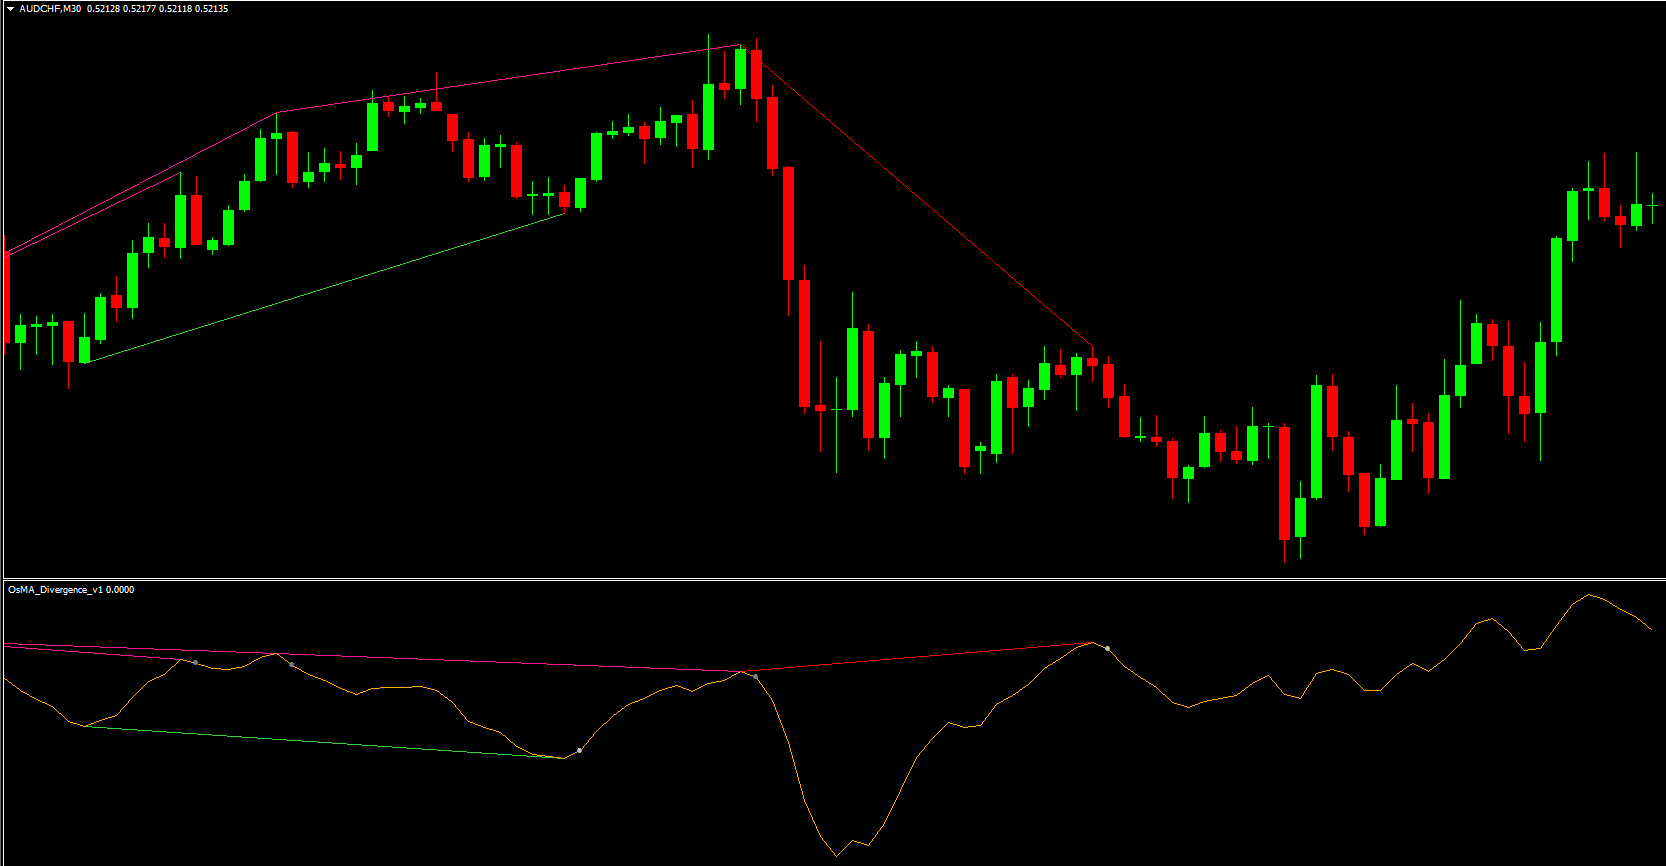
An advanced divergence indicator analyzes both the OsMA and Price Action to detect discrepancies known as “divergences,” which often precede price reversals or continuation movements.
What Are Divergences?
Divergences occur when the price and the indicator move in different directions. This suggests that momentum is weakening or strengthening beneath the surface, even when price doesn’t show it yet.
Analysts distinguish two types of divergences:
Classic (Regular) Divergence
Classic divergence signals a potential Trend Reversal:
Bullish divergence: price makes lower lows, OsMA makes higher lows
Bearish divergence: price makes higher highs, OsMA makes lower highs
These patterns indicate weakening momentum in the existing trend.
Hidden Divergence
Hidden divergences support Trend Continuation:
Hidden bullish divergence: price makes higher lows, OsMA makes lower lows
Hidden bearish divergence: price makes lower highs, OsMA makes higher highs
These suggest the main trend is likely to resume.
Because divergences alone can give false signals, it is crucial to check the current market trend. For example, give priority to buy setups in a bullish market and sell setups in a bearish market.
Using the OsMA Divergence Indicator for MT4
The OsMA Divergence Indicator automatically scans the chart for divergence patterns and marks them clearly. This helps traders quickly identify potential setups without manually comparing highs and lows.
You can use this indicator on daily, weekly, or intraday charts. It also allows full historical analysis so you can evaluate how well divergences work in specific markets.
Sell Signals with OsMA Divergence
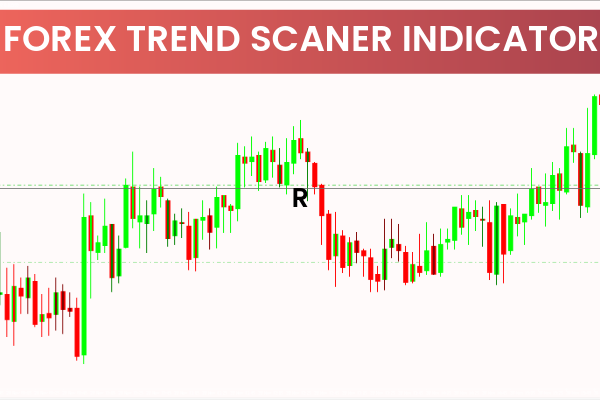
Support And Resistance levels significantly enhance divergence accuracy.
For example:
When price breaks a support level and retests it as resistance
A bearish OsMA divergence forms near this resistance
A short position can be considered below the resistance line
Stop-loss orders should be placed above resistance, and profits can be taken when the OsMA reaches a new low or when price makes a new swing low.
Buy Signals with OsMA Divergence
If a strong support zone holds and a bullish divergence forms:
A long entry can be taken above the support
Stops can be placed below the support or previous lows
The take-profit target is usually positioned at new price highs or next resistance levels
This method works especially well when combined with trend direction and clean price-action levels.
Advantages of the OsMA Divergence Indicator
The OsMA Divergence Indicator for MetaTrader offers multiple benefits:
Fully automated divergence detection
Works on all timeframes
Easy-to-read visual signals
Customizable parameters
Ability to backtest divergence effectiveness
Though no indicator guarantees perfect signals, combining OsMA divergence with trend direction, support/resistance, and proper risk management greatly improves accuracy.
Final Thoughts
The OsMA Divergence Indicator is a valuable tool for identifying both reversals and continuations in the market. When used correctly—especially alongside key levels and trend analysis—it can significantly enhance your trading strategy. Always practice on a demo account and remember to apply appropriate stop-loss orders.
For more trading tools, indicators, and guides, visit IndicatorForest.com.
FAQ
Published:
Nov 23, 2025 09:19 AM
Category: