The PPO Indicator for MT5 (Percentage Price Oscillator) is a powerful Momentum Indicator that helps forex traders analyze market strength and trend direction. Similar to the popular MACD, the PPO Indicator for MT5 measures the percentage difference between two moving averages, allowing traders to identify bullish and bearish signals more accurately.
Unlike the MACD, which uses absolute values, the PPO Indicator for MT5 expresses differences as percentages, making it more effective when comparing price movements across various assets and timeframes. Whether you’re a beginner or an experienced trader, the PPO can be easily integrated into your strategy to enhance your decision-making.
How the PPO Indicator for MT5 Works
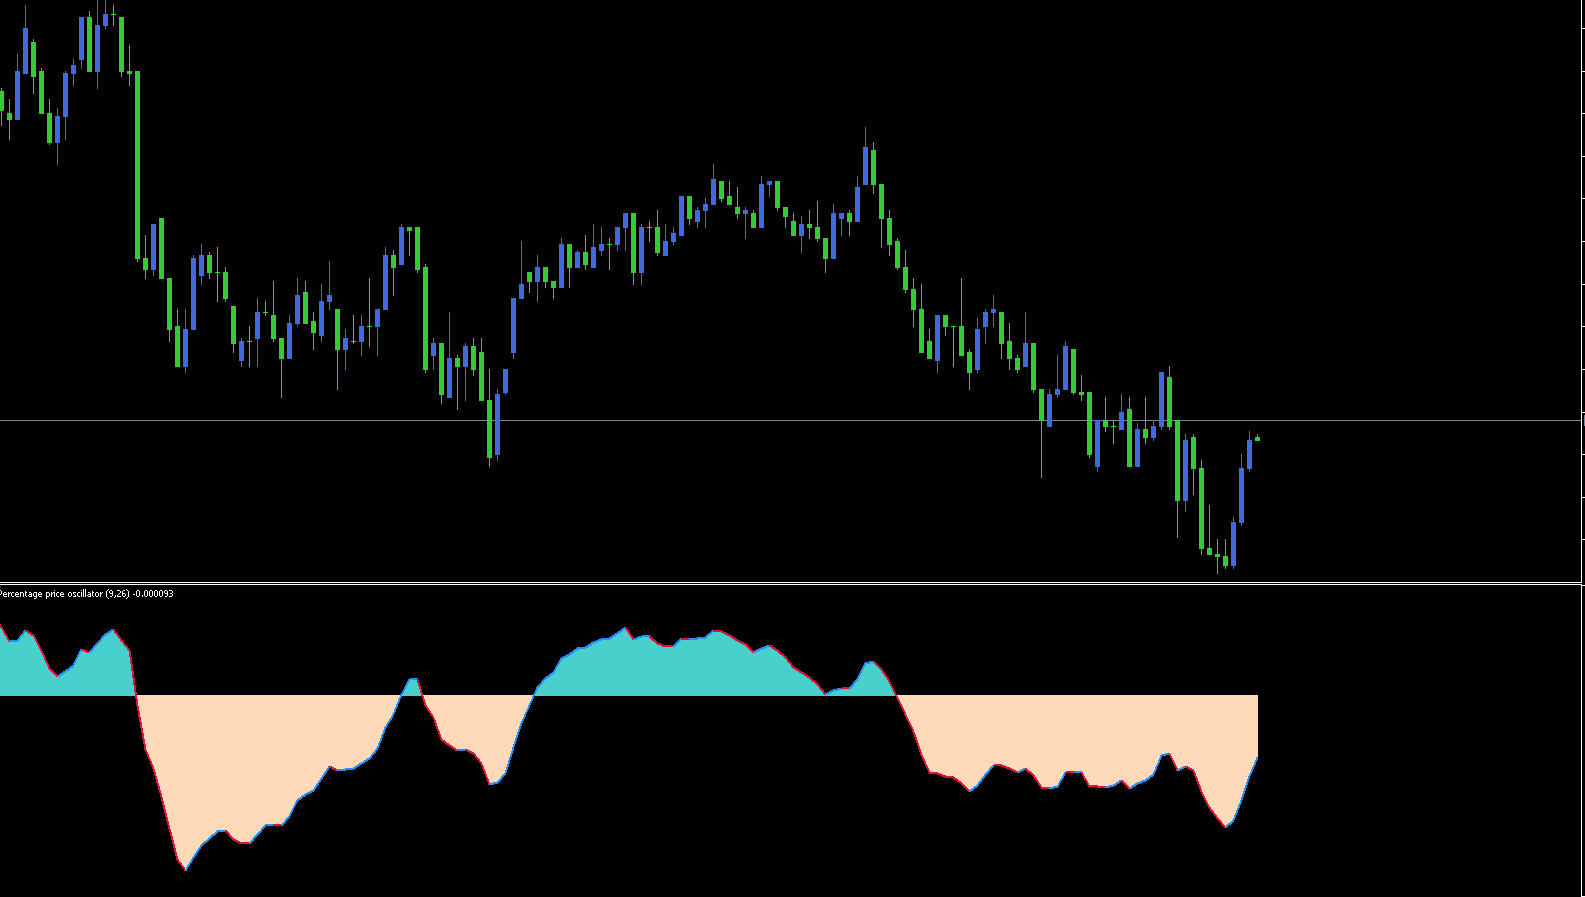
The PPO indicator plots two key lines: the PPO line and the signal line.
When the PPO line crosses above the signal line, it generates a bullish trading signal, suggesting a potential buying opportunity.
Conversely, when the PPO line crosses below the signal line, it signals a bearish condition, prompting traders to consider short positions.
Additionally, the indicator includes a zero line, which helps identify overall trend direction:
Above zero → bullish market
Below zero → bearish market
The distance between the PPO line and the zero line reflects momentum strength. The greater the distance, the stronger the trend.
PPO Indicator for MT5 Trading Signals
Let’s consider a GBP/USD H1 candlestick chart using the PPO Indicator for MT5. When the PPO line crosses the signal line upward, forex traders can enter a buy trade with a stop loss placed below the most recent swing low.
If the PPO line crosses downward, it’s a sell signal, and traders can place a short position with a stop loss above the previous swing high.
Zero-Line Crossovers
Another method to interpret signals is by observing zero-line crossovers.
A cross above the zero line confirms an uptrend.
A cross below the zero line confirms a downtrend.
These crossovers help traders identify trend reversals early.
Using Divergence and Convergence
The PPO Indicator for MT5 is also excellent for spotting divergences and convergences, which can act as leading indicators.
Bullish divergence occurs when price forms lower lows while the PPO forms higher lows — an early sign of a potential upward reversal.
Bearish divergence happens when price forms higher highs but the PPO forms lower highs, signaling a possible downtrend.
Such setups allow traders to prepare for trend reversals before they occur, improving entry timing and trade accuracy.
Applying the PPO Indicator Across Timeframes
The PPO indicator for MT5 can be applied to any timeframe — intraday, daily, weekly, or even monthly charts. It’s flexible for Scalping, swing trading, and long-term trading strategies.
Because it’s built into MetaTrader 5, installation is quick and easy. You can download the PPO indicator for free from IndicatorForest.com and start using it immediately.
PPO vs. MACD Indicator
Although the PPO Indicator for MT5 and MACD look similar, the main distinction lies in their calculation methods:
MACD = difference between two EMAs (absolute value)
PPO = difference between EMAs as a percentage of the longer EMA
This percentage-based approach gives the PPO a normalized scale, making it more effective for comparing different forex pairs or instruments with varying price levels.
Trading Tips for the PPO Indicator
To maximize the effectiveness of the PPO Indicator for MT5, consider combining it with:
Support And Resistance levels
Moving averages
Volume indicators
Trendlines or Price Action patterns
While PPO signals are reliable, no indicator guarantees 100% accuracy. Always confirm with other tools before executing trades.
Conclusion
The PPO Indicator for MT5 is a versatile and accurate tool for forex traders who want to gauge market momentum, identify divergences, and capture trends. Its percentage-based calculation makes it especially useful for comparing various assets.
However, as with the MACD, traders should use it in conjunction with other indicators to filter out false signals.
👉 Ready to enhance your trading strategy?
Download the PPO Indicator for MT5 for free at IndicatorForest.com and start improving your forex performance today.
1 Download
Published:
Nov 03, 2025 03:02 AM
Category: