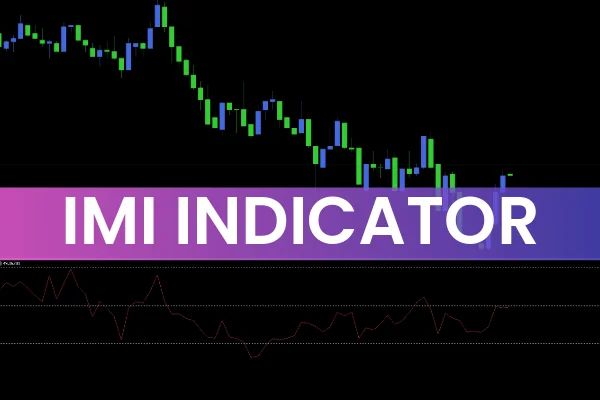
The IMI Indicator for MetaTrader (Intraday Momentum Index) is a short-term trading tool designed to analyze trend momentum and identify potential reversal points. Based on Relative Strength Index (RSI) data and the opening and closing prices of candlesticks, the IMI acts as an oscillator that moves between overbought and oversold zones.

Traders use the IMI indicator to pinpoint market conditions where price reversals are likely to occur. Typically, the indicator identifies level 70 as overbought and level 30 as oversold. When the IMI line reaches these thresholds, it signals a possible turning point in market momentum.
How the IMI Indicator Works
The IMI indicator oscillates between two extremes — similar to the RSI — but provides more refined intraday insights. It helps traders determine when an asset may be overbought (potentially leading to a sell opportunity) or oversold (potentially leading to a buy opportunity).
Overbought Zone (70): When the IMI line crosses above 70, the asset may be nearing exhaustion on the upside. Traders can look for bearish reversal patterns to confirm a sell setup.
Oversold Zone (30): When the IMI dips below 30, it indicates that the asset could be undervalued. Traders can look for bullish reversal patterns before entering a buy position.
This makes the IMI Indicator for MetaTrader an excellent tool for scalpers, day traders, and swing traders who rely on short-term price movements.
How to Trade with the IMI Indicator
To trade effectively using the IMI indicator, combine it with Price Action or other technical indicators such as moving averages or trendlines. Here’s how to use it for both buy and sell signals:
Buy (Long) Signal
Confirm that the market is in an uptrend.
Wait until the IMI red line touches or dips below the oversold level (30).
Look for a bullish reversal candlestick pattern, such as a bullish engulfing candle.
Enter a BUY/LONG position after confirmation.
Sell (Short) Signal
Confirm that the market is in a downtrend.
Wait until the IMI red line touches or exceeds the overbought level (70).
Look for a bearish reversal pattern, such as a bearish engulfing candle.
Enter a SELL/SHORT position after confirmation.
By following these simple steps, traders can increase the probability of capturing high-quality entries while minimizing false signals.
Best Market Conditions for the IMI Indicator
The IMI Indicator for MetaTrader works best in a trending market. During periods of sideways movement or low volatility, false signals can occur more frequently. To reduce noise, traders often use the IMI alongside Trend Confirmation tools like Moving Average Convergence Divergence (MACD) or Support And Resistance levels.
Why Use the IMI Indicator
Ideal for intraday and Scalping strategies
Easy to interpret for both beginners and professionals
Works well with price action confirmation
Available free for download on IndicatorForest.com
The IMI indicator can help you make more confident trading decisions by highlighting areas where momentum is likely to shift.
Conclusion
The IMI Indicator for MetaTrader is a valuable oscillator for detecting overbought and oversold levels in trending markets. While no indicator is 100% accurate, using the IMI in conjunction with other tools can significantly enhance your market timing.
👉 Ready to improve your trading accuracy? Download the IMI Indicator for MetaTrader for free today at IndicatorForest.com.
Published:
Nov 03, 2025 02:25 AM
Category: