The Double CCI with SMA indicator is a highly effective technical tool for traders looking for precise trend signals. Combining two Commodity Channel Indexes (CCI) and a Simple Moving Average (SMA), this indicator simplifies trend detection and entry timing, boasting a high success rate in various market conditions.
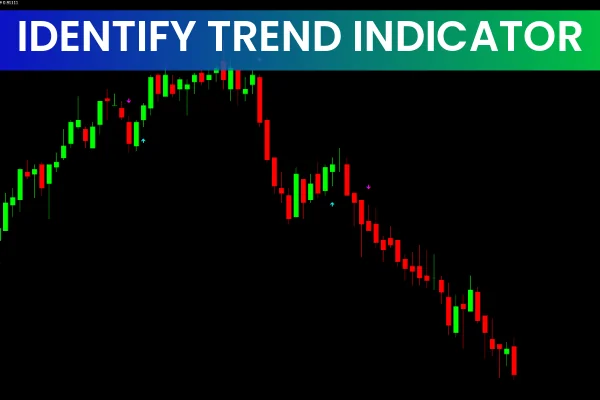
The indicator is displayed in a separate window below the price chart, making it easy to interpret. Traders can use it as a standalone Trend Indicator or combine it with other tools such as support/resistance zones, Price Action methods, or oscillators for a more refined trading strategy.
It is versatile enough to trade any financial instrument across multiple timeframes, from M1 to H4 or daily charts. Users can tweak the CCI and SMA parameters to suit their trading style.
How the Double CCI with SMA Works
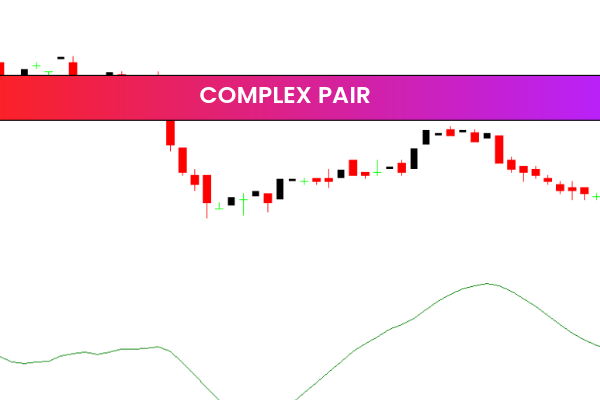
The indicator provides bullish and bearish signals through a combination of line crossovers and colored histogram bars:
Bullish (Buy) signals: Lime green bars
Bearish (Sell) signals: Red bars
Intermediate or neutral zones may be represented by orange or yellow bars
Additionally, the indicator uses the zero line as a reference to confirm trend direction. When the entry CCI crosses above the trend CCI and the histogram moves above zero, the trend is considered bullish. Conversely, a crossover below the trend CCI while moving below the zero line signals bearish conditions.
Trading Signals
Buy Signal
Bars change from red-orange to lime green
Indicator moves above the zero line
Entry CCI crosses above the trend CCI
This combination confirms strong upward momentum and provides high-probability long trade setups.
Sell Signal
Bars change from lime green to red-orange
Indicator crosses below the zero line
Entry CCI crosses below trend CCI
This indicates that the uptrend is losing strength and a potential downtrend is starting. Waiting for bar color confirmation ensures more reliable entries.
Exit Strategy
To protect capital and maximize profits, apply the following exit rules:
Stop Loss:
For long trades: a few pips below the most recent swing low
For short trades: a few pips above the recent swing high
Take Profit: Set near key support or resistance levels, or recent areas of interest
Adjust stops manually as price action develops to lock profits
Real Market Example
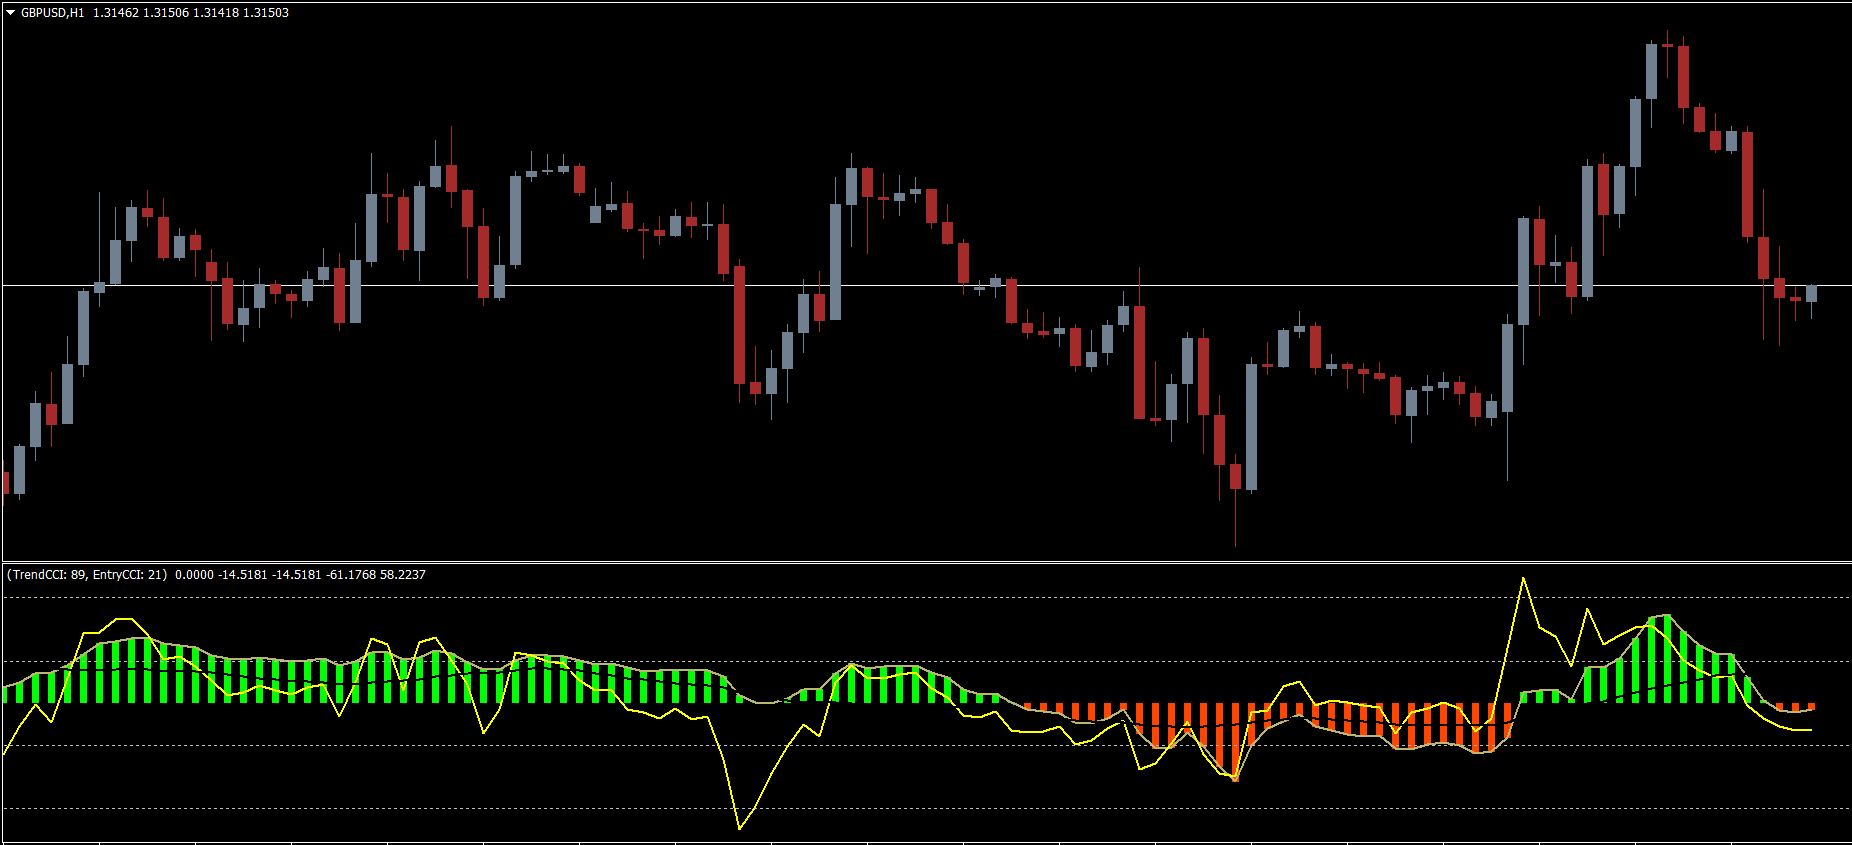
On the EUR/USD H1 chart, the yellow line represents the entry CCI, while the black line is the trend CCI.
When the yellow line crosses above the black line, and the histogram turns lime green above zero, it confirms a strong uptrend, signaling a buy entry.
Later, when the yellow line drops below the black line and the bars change to red-orange below zero, it provides a sell signal, indicating a possible downtrend.
This combination of color-coded bars, zero-line reference, and CCI crossover allows traders to enter with high probability and exit efficiently.
Why Use the Double CCI with SMA Indicator
Combines multiple technical tools to refine trade entries
Reduces false signals using crossover and zero-line filters
Works on any timeframe or trading instrument
Easy to interpret with colored bars and line crossovers
Helps minimize losses and maximize profitability
Whether used as a standalone indicator or with other technical tools, the Double CCI with SMA is ideal for traders seeking reliable trend-following signals and clear trade timing.
For more free MT4 indicators, visit IndicatorForest.com.
FAQ
2 Downloads
Published:
Nov 13, 2025 21:28 PM
Category: