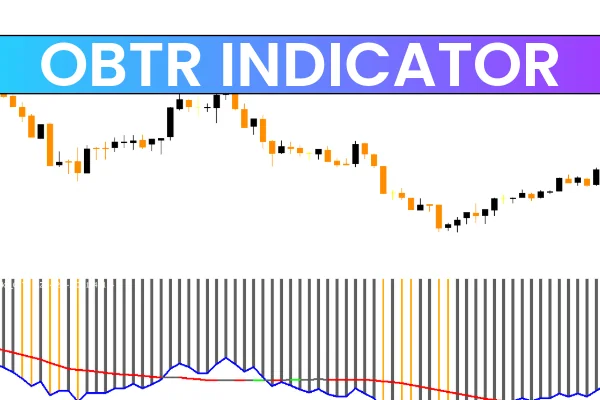
The OBTR Indicator for MT4 was developed by Tom Bierovic. OBTR stands for On Balance True Range. It is based on the classic OBV (On Balance Volume) indicator, which is included by default in MT4.
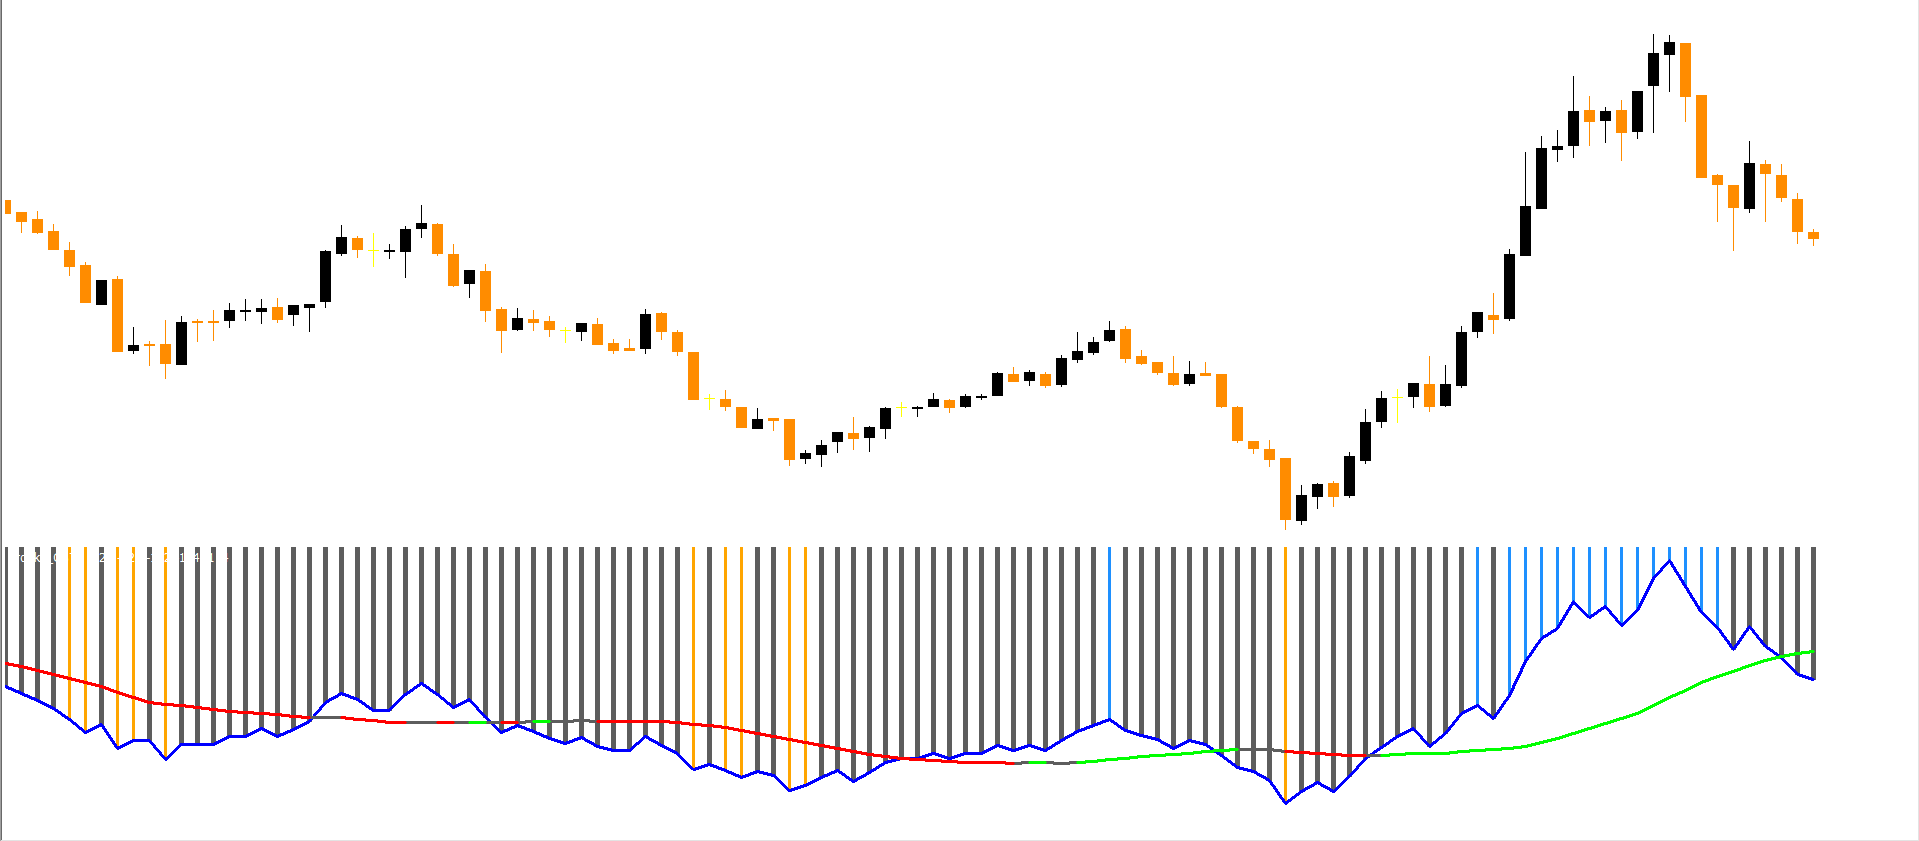
The indicator displays the main OBTR line in blue, which replicates the OBV line, and an additional moving average line that changes color between red and green. A 3-color histogram with gray, blue, and orange bars also helps identify market conditions.
How to Use the OBTR Indicator for Trading
The OBTR indicator does not provide simple buy and sell arrows. Traders need to analyze the chart in combination with OBTR readings to make informed decisions. It is particularly useful for trend traders.
Basic rules include:
Red moving average indicates a bearish trend; prefer opening short positions.
Green moving average indicates a bullish trend; prefer opening long positions.
Blue histogram bars suggest potential long entries.
Orange histogram bars suggest potential short entries.
Gray histogram bars with the main OBTR line far from the moving average may indicate closing a position or trading against the trend.
Sell Signals
For example, a sell signal occurs when the moving average is red and pointing downward, the histogram changes from blue to orange, and the main OBTR line is pointing down. This indicates that bullish short-term momentum is over, and the bearish trend is likely to resume. A stop-loss can be placed above the previous local high. Positions can be closed when the bars turn gray and the moving average is far from the main line.
Buy Signals
A buy signal occurs when the moving average is green and pointing upward, the main OBTR line is near the moving average, and the histogram bars are blue. This indicates a potential long entry. A stop-loss may be placed below the previous local low. Positions should be closed when the histogram turns gray and the main line moves away from the moving average.
Peculiarities of Trading with OBTR
The indicator works best on higher timeframes such as daily or weekly charts. On fast timeframes like M5, it may give false signals.
Frequent overlapping of the main line and moving average indicates the absence of a steady trend. Some lag may occur due to the built-in moving average.
OBTR allows flexibility to combine strategies across multiple timeframes. For example, traders can identify the general trend on a higher timeframe and then trade breakouts or support/resistance on lower timeframes.
Conclusion
The OBTR Indicator for MT4 helps traders operate along or against the trend. It is not ideal for beginners because it requires additional analysis, but it is highly versatile for experienced traders.
Advantages:
Non-repaint
Applicable to any market: forex, stocks, and others
Volume-based
Can be combined with trendlines, chart patterns, and other methods
Disadvantages:
No automatic arrows; manual analysis required
Lag due to moving average
Calculation formula is not public
Traders should practice using OBTR on a demo account before risking real money. All Metatrader brokers provide demo accounts for testing.
FAQ
1 Download
Published:
Nov 17, 2025 03:53 AM
Category: