The Bollinger Bands RSI Indicator is a powerful technical analysis tool that merges two of the most popular indicators in trading: Bollinger Bands and the Relative Strength Index (RSI). By combining these, traders gain a clearer view of market volatility and momentum strength, helping to identify overbought or oversold conditions more accurately. Whether you’re trading forex, stocks, or crypto, the Bollinger Bands RSI Indicator can refine your entry and exit points and improve your overall market timing.
At IndicatorForest.com, this indicator is available for traders who want to elevate their strategy with reliable, data-driven insights.
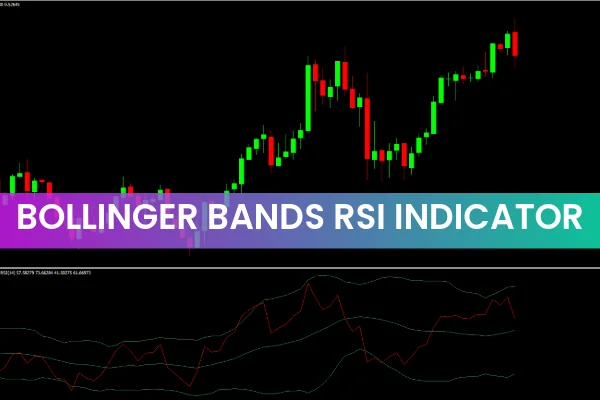
What Is the Bollinger Bands RSI Indicator?
The Bollinger Bands RSI Indicator fuses Bollinger Bands, which measure price volatility, with the RSI, which measures momentum. Bollinger Bands consist of three lines — the upper band, middle band (usually a moving average), and lower band. RSI oscillates between 0 and 100, showing whether a market is overbought or oversold.
When combined, these two indicators help traders spot not just trend direction but also the strength and volatility behind it. This synergy creates a dynamic tool that’s more informative than using Bollinger Bands or RSI alone.
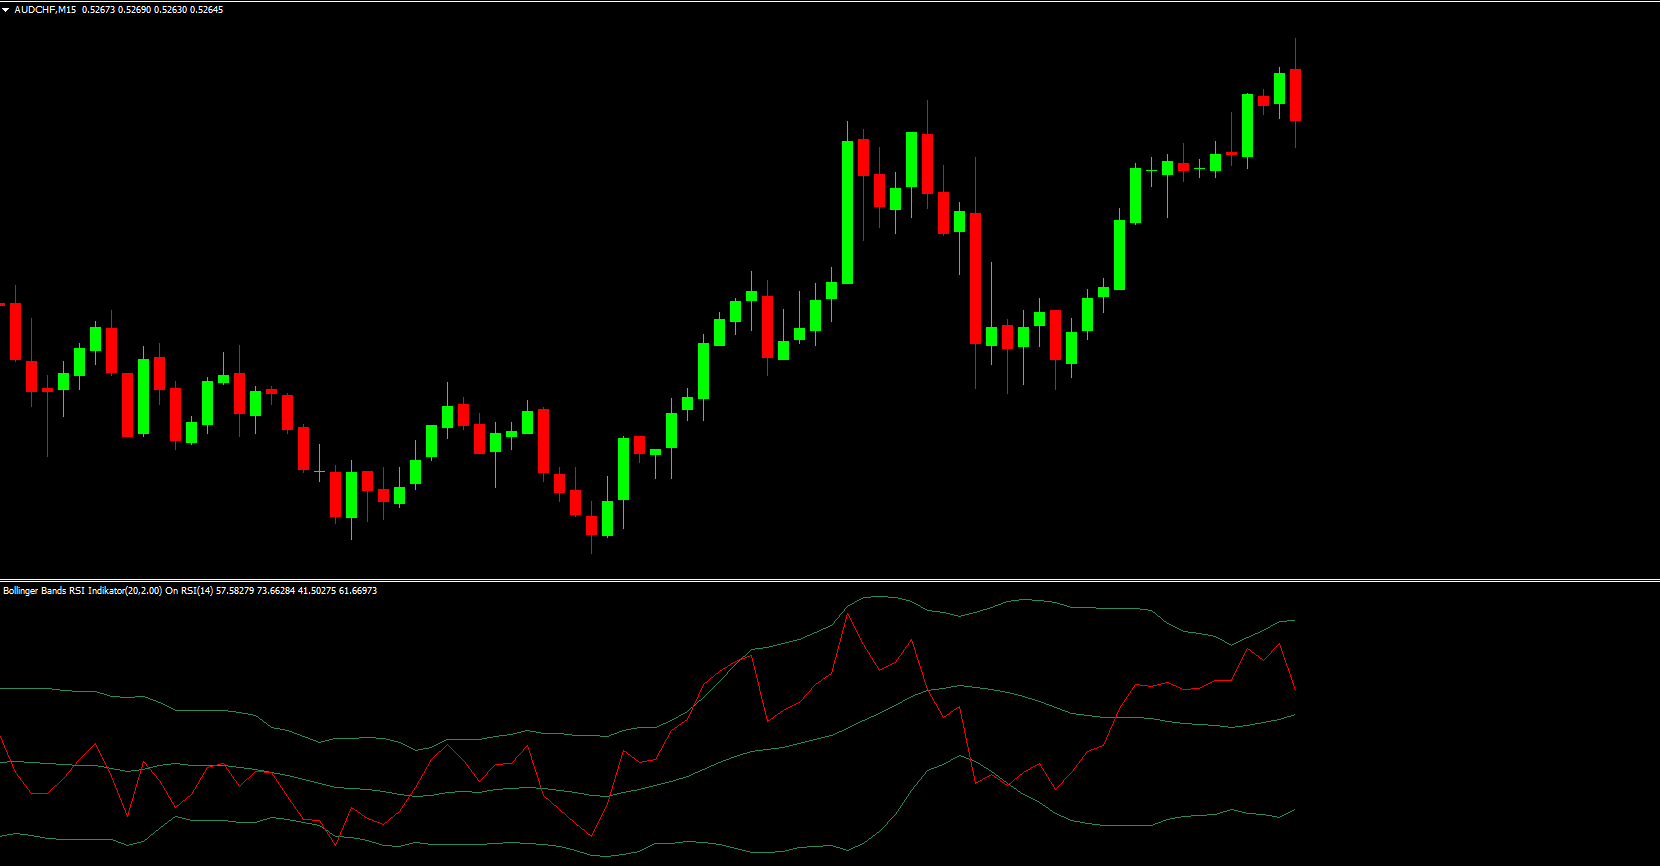
How Bollinger Bands RSI Trading Signals Work
The indicator generates actionable trading signals based on RSI’s position relative to the Bollinger Bands. Here’s how it works:
Overbought Signal
When the RSI crosses above the upper Bollinger Band, it indicates that the market might be overbought. This can be a signal for traders to prepare for a potential reversal or sell opportunity. However, confirmation with other indicators or price patterns is always recommended.
Oversold Signal
Conversely, when the RSI drops below the lower Bollinger Band, it signals an oversold condition, suggesting a possible buying opportunity. This often happens after a strong downtrend, where the market may soon rebound.
Neutral or No Signal
If RSI stays within the bands, it reflects stable market momentum and no immediate trading signal. In such cases, traders may choose to wait for clearer market cues before entering a position.
Why Use the Bollinger Bands RSI Indicator?
This hybrid indicator offers several benefits:
Enhanced accuracy: Combines volatility and momentum for more reliable signals.
Trend and reversal detection: Works well in both trending and ranging markets.
Visual clarity: Makes it easier to see price strength and weakness zones.
Customizable settings: Traders can adjust RSI periods and Bollinger Band parameters for their preferred strategy.
Whether you’re a swing trader, day trader, or long-term investor, the Bollinger Bands RSI Indicator provides deeper market insights that can help you make smarter decisions.
Tips for Using the Indicator Effectively
Combine with volume indicators for stronger confirmations.
Avoid using it alone — pair it with support/resistance or moving averages.
Watch volatility changes — a narrowing band suggests reduced activity, while widening bands indicate strong market movement.
Backtest your strategy to ensure compatibility with your trading style.
Conclusion
The Bollinger Bands RSI Indicator is an excellent addition to any trader’s toolkit. By blending the volatility measurement of Bollinger Bands with the momentum tracking of RSI, it helps identify high-probability trading opportunities with confidence.
Ready to experience the power of advanced trading analytics?
👉 Download the Bollinger Bands RSI Indicator now at IndicatorForest.com and take your technical analysis to the next level.
Published:
Nov 01, 2025 13:16 PM
Category: