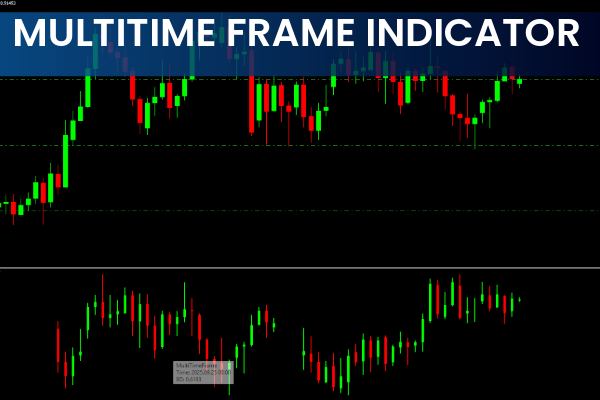
The Multi Time Frame (MTF) Indicator for MT4 is a powerful forex trading tool that allows traders to view multiple timeframes of a single currency pair on the same chart. By showing higher, intermediate, and lower timeframes simultaneously, the indicator helps traders make more informed decisions.
This indicator is particularly useful for understanding how different market participants view the same currency pair. For example, a pair might show a downtrend on H4 but an uptrend on the daily chart. The MTF indicator consolidates these perspectives, providing a holistic view of the market.
Foundation of the Multi Time Frame Indicator
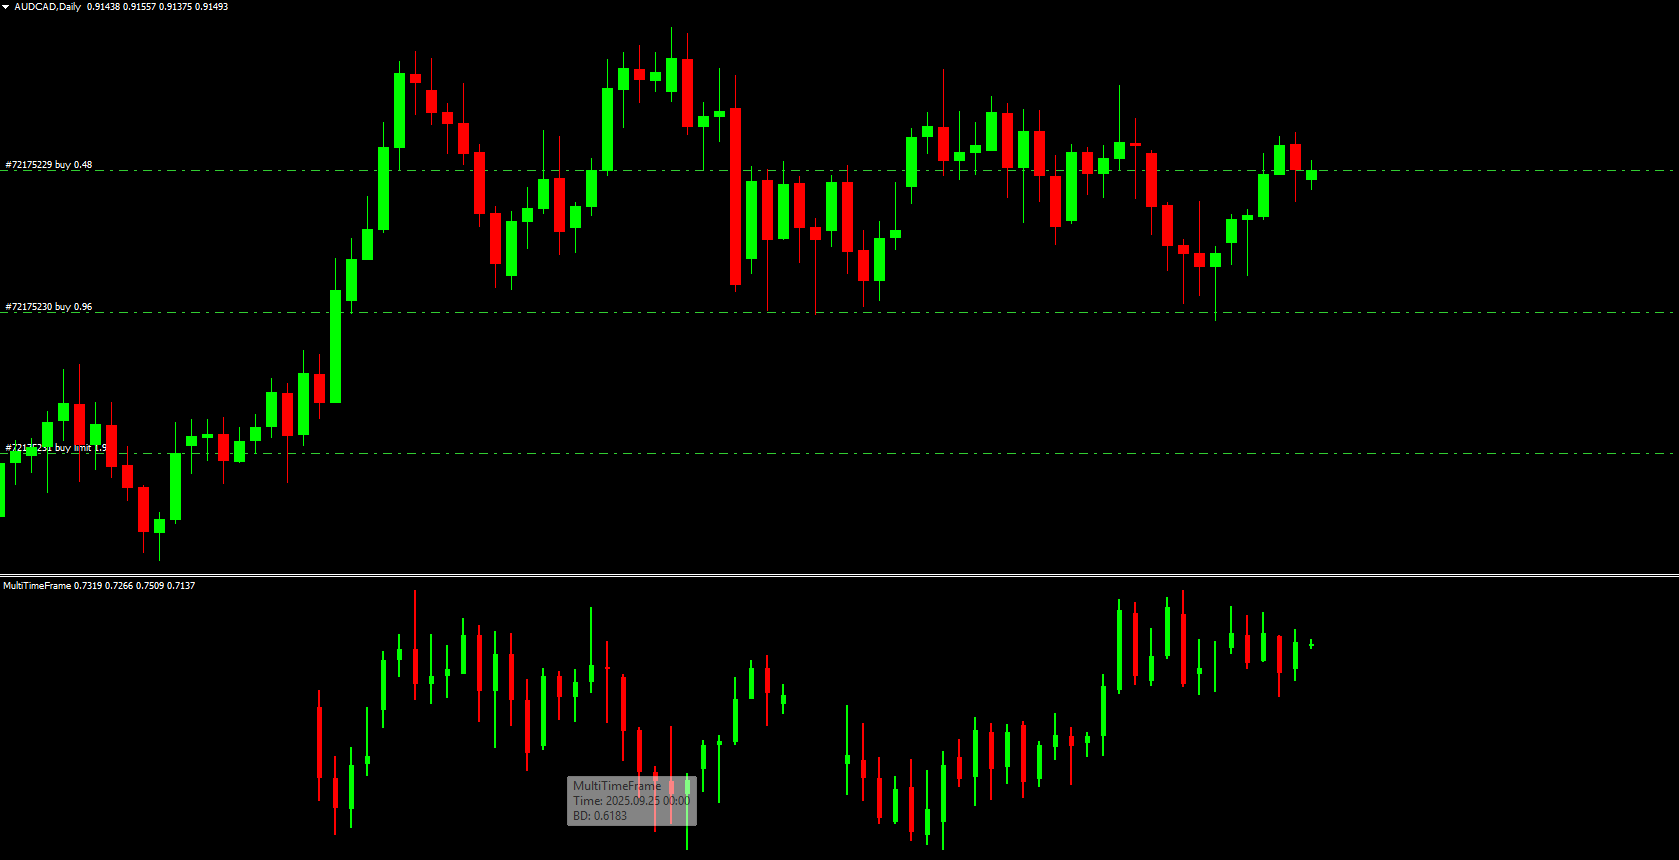
The MTF indicator typically displays three timeframes on the chart:
Weekly timeframe (W1) – Shows the main trend and the bigger picture of the market.
Daily timeframe (D1) – Serves as the intermediate trend to identify breakouts and potential trade entries.
4-hour timeframe (H4) – Provides primary confirmation for trade entries or exits.
These three timeframes are displayed in an organized manner on the indicator window, allowing traders to spot trends, potential support/resistance levels, and trend reversals early.
Why Use the Multi Time Frame Indicator?
The MTF Indicator for MT4 offers several advantages:
Different Market Perspectives – View small, medium, and big picture trends simultaneously.
Trend Confirmation – Confirm trend changes in higher timeframes before trading on lower timeframes.
Early Trade Entries – Spot potential trade setups ahead of the market.
Support And Resistance Identification – Easily detect upcoming price levels for informed decision-making.
Adaptable for All Traders – Suitable for scalpers, intraday, swing, and position traders.
How to Use the Multi Time Frame Indicator in MT4
Analyze Higher Timeframe
Begin with the weekly chart (W1) to determine the main market trend. Long-term trends are slower to develop but provide high-priority signals.
Check Intermediate Timeframe
Use the daily chart (D1) to observe the intermediate trend and pinpoint potential breakouts or trade entries.
Confirm with Lower Timeframe
Finally, review the H4 chart for confirmation of the trend and optimal entry or exit points.
For example, if the weekly chart shows bullish momentum, the daily chart confirms bullish candles, and the H4 chart shows strengthening momentum, traders may consider entering a buy position.
Adjusting MTF Indicator for Different Trading Styles
Scalpers: M30, M15, M5 or M30, M5, M1 timeframes
Intraday Traders: H4, H1, M15 or D1, H4, H1 timeframes
Swing Traders: W1, D1, H4 timeframes
Position Traders: MN, W1, D1 timeframes
This flexibility allows traders to customize the indicator according to their preferred trading strategy and timeframe priorities.
Conclusion
The Multi Time Frame Indicator for MT4 provides traders with a comprehensive view of the forex market by displaying main, intermediate, and primary timeframes on one chart. By offering early insights into trends, support/resistance levels, and market sentiment, this indicator is suitable for all types of traders.
For effective forex trading, download and implement the Multi Time Frame Indicator from IndicatorForest.com and analyze multiple timeframes effortlessly.
FAQ
6 Downloads
Published:
Dec 01, 2025 01:57 AM
Category: