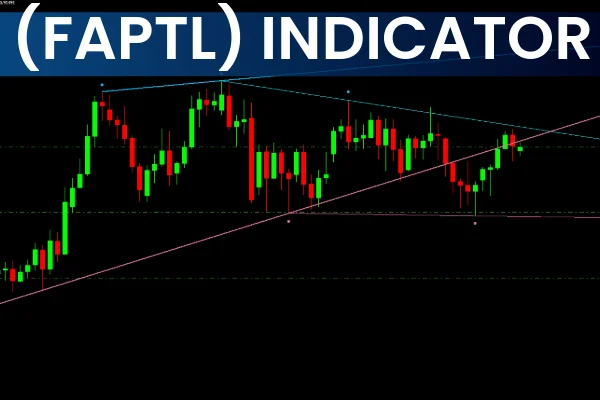
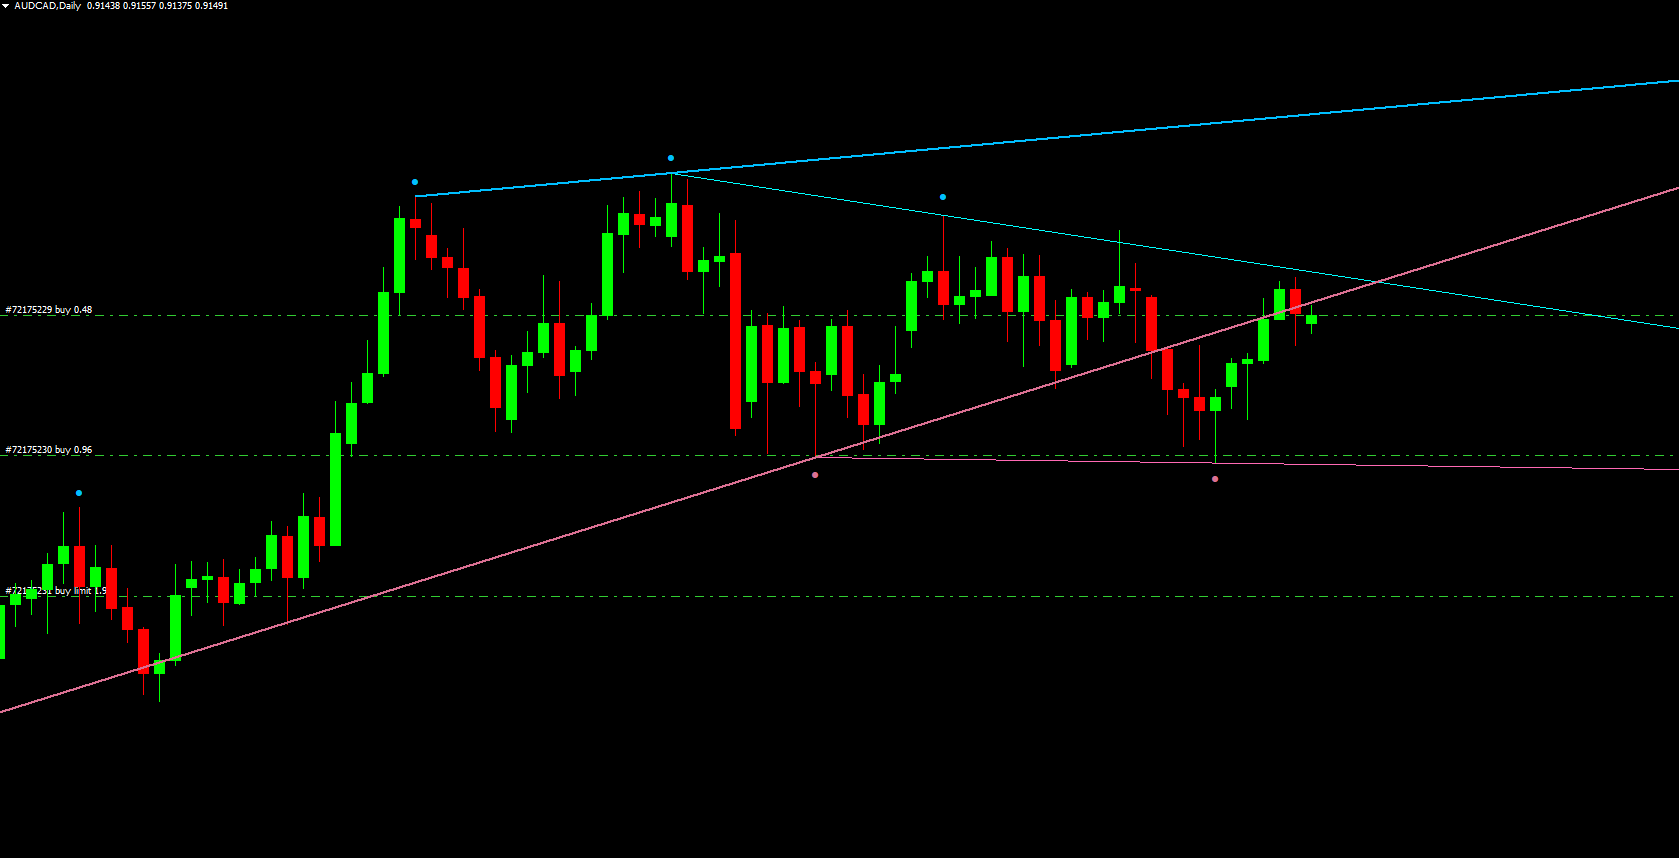
The Fractals Adjustable Period Trend Lines indicator for MT4 is a powerful trend analysis tool that plots dynamic trendlines based on fractals. It allows forex traders to visualize bullish and bearish market conditions and identify optimal buy and sell entry points.
One of its key features is the ability to display trendlines from other timeframes on the current chart. This makes it an essential tool for multi-timeframe traders, helping them identify Support And Resistance levels from higher timeframes while trading on lower timeframes.
This indicator is suitable for both novice and advanced forex traders and can be applied to intraday, daily, weekly, and monthly charts. It is also free to download and easy to install.
How the Fractals Trend Lines Indicator Works
The indicator differentiates completed and uncompleted trendlines:
Completed Uptrend Lines: DEEP SKY BLUE
Uncompleted Uptrend Lines: AQUA
Completed Downtrend Lines: PALE VIOLET RED
Uncompleted Downtrend Lines: HOT PINK
When a trendline is completed:
Completed Uptrend: Indicates a BULLISH market → traders may enter a BUY position.
Completed Downtrend: Indicates a BEARISH market → traders may enter a SELL position.
Traders typically place a stop-loss below the previous low (for buy trades) or above the previous high (for sell trades) and set targets toward the opposite fractal or trendline.
Using the Indicator for Multi-Timeframe Trading
The Fractals Adjustable Period Trend Lines indicator excels in multi-timeframe (MTF) analysis. By displaying trendlines from higher timeframes directly on the current chart, traders can:
Identify key support and resistance from higher timeframes.
Determine entry and exit points in lower timeframes.
Combine trendline analysis with other technical indicators to improve accuracy.
For example, a completed uptrend line on the H4 chart may act as strong support when trading on the H1 chart. Similarly, a completed downtrend line from the daily chart can serve as resistance on intraday timeframes.
Trading Strategy With Fractals Trend Lines
Buy Setup:
Wait for a completed uptrend line on the current or higher timeframe.
Confirm bullish momentum with Price Action or other indicators.
Place a BUY trade with a stop-loss below the previous swing low.
Set the target at the opposite fractal or trendline.
Sell Setup:
Wait for a completed downtrend line on the current or higher timeframe.
Confirm bearish momentum with price action or other indicators.
Place a SELL trade with a stop-loss above the previous swing high.
Set the target at the opposite fractal or trendline.
Conclusion
The Fractals Adjustable Period Trend Lines indicator for MT4 is an essential tool for forex traders. It provides:
Clear bullish and bearish trend signals.
Support and resistance levels from multiple timeframes.
Optimal buy and sell entry points for intraday and long-term trades.
By incorporating multi-timeframe analysis, this indicator helps traders increase accuracy and manage risk effectively. You can download it for free from IndicatorForest.com and start using it on your MT4 platform today.
FAQ
5 Downloads
Published:
Dec 01, 2025 02:02 AM
Category: