The Beginner Indicator for MetaTrader 5 is an easy-to-use trend-following system designed for traders who want to identify meaningful market highs and lows. By analyzing Price Action, it detects Support And Resistance zones, helping traders spot potential reversals and continuation signals.
This MT5 indicator compares price peaks and valleys with the trading range covered during a given period. As a result, it offers clear visual guidance to traders who prefer technical clarity without complex setups.
How the Beginner Indicator Works
Analyzing Market Highs and Lows
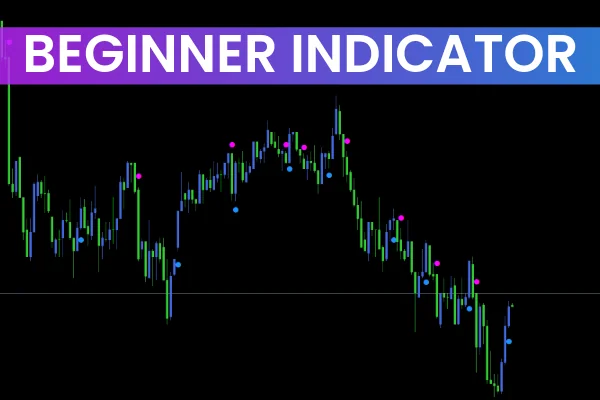
The Beginner Indicator marks swing highs and swing lows directly on your MetaTrader 5 chart.
Pink dots represent swing highs (potential resistance zones).
Blue dots indicate swing lows (potential support zones).
These dots do not serve as direct buy or sell signals but highlight key price levels worth watching. When price approaches or breaks one of these zones, traders can look for confirmation from price action or other technical indicators.
Support and Resistance Dynamics
The highs and lows generated by the indicator often align with psychological price levels that can either hold as barriers or become breakout zones.
If the price reverses upon touching a dot, it signals a potential retracement.
If the price breaks and retests the level, it could indicate trend continuation.
This behavior makes the Beginner Indicator for MT5 ideal for identifying both reversal and breakout trading opportunities.
How to Trade with the Beginner Indicator
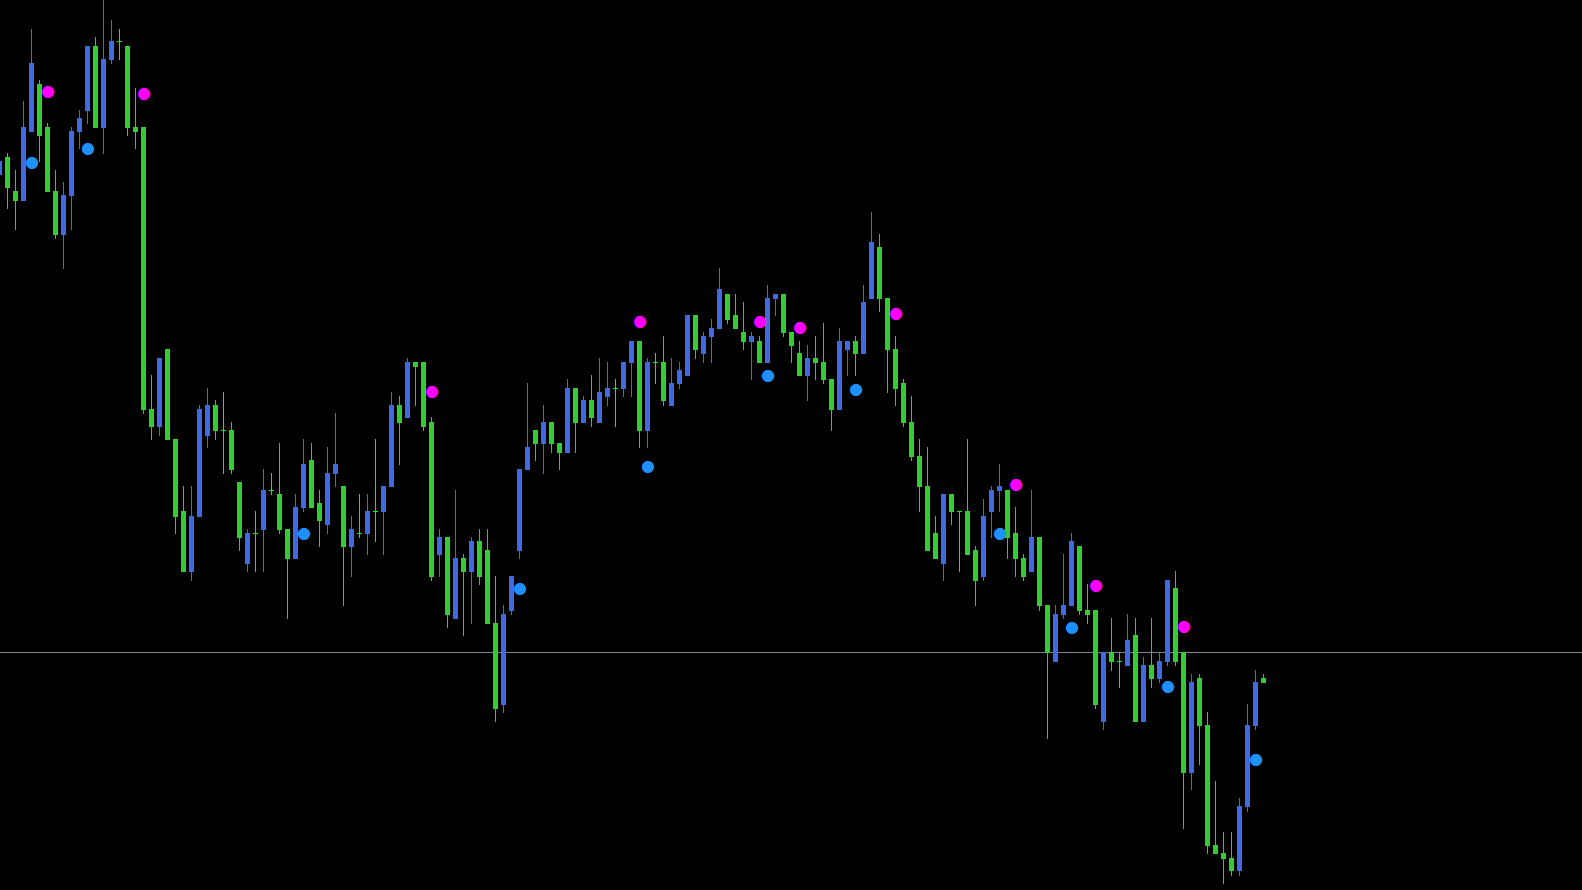
The image below (EURJPY, M30 timeframe) demonstrates how the Beginner Indicator performs in real-market conditions. The indicator highlights:
Pink dots = resistance levels
Blue dots = support levels
When price breaks above a pink dot (resistance) and retests it successfully, it often provides a buy opportunity. Conversely, when price falls below a blue dot (support) and retests it, it may present a sell opportunity.
Example Trading Setup:
Wait for the price to approach a dot (support or resistance).
Watch for a breakout and retest confirmation.
Confirm the move with a trendline, moving average, or candlestick pattern.
Enter a trade in the direction of the breakout.
However, remember that this tool may redraw past points as new data arrives. Therefore, it’s best used alongside other indicators or price action techniques for higher accuracy.
Tips for Using the Beginner Indicator Effectively
Combine it with Moving Averages, RSI, or MACD for confirmation.
Use it on higher timeframes (H1, H4, or Daily) for more reliable zones.
Avoid trading every dot—focus on confluence zones where multiple indicators agree.
Always apply proper risk management and confirm setups before entering.
Why Use the Beginner Indicator for MT5
Simple and visually clear
Highlights strong support and resistance zones
Suitable for trend-following and reversal trading
Works on all major currency pairs and timeframes
Free download available at IndicatorForest.com
Whether you are a beginner or experienced trader, this tool can help you interpret price action more effectively and make smarter trading decisions.
Conclusion
The Beginner Indicator for MetaTrader 5 is a powerful yet simple trend-following indicator that helps traders identify key market turning points. It’s best used as part of a broader trading strategy, supported by other technical tools or price action analysis.
You can download the Beginner Indicator for MT5 for free today at IndicatorForest.com and start improving your trading accuracy!
7 Downloads
Published:
Nov 04, 2025 01:09 AM
Category: