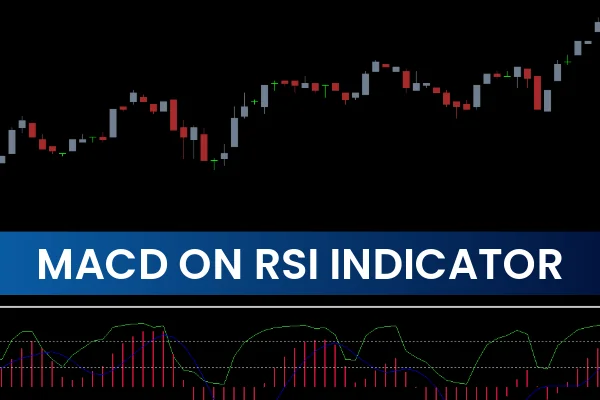
The MACD on RSI Indicator is a powerful and easy-to-use technical tool that blends two of the most respected momentum indicators in forex trading—MACD and RSI. By combining these tools, the indicator helps traders identify trend direction, momentum strength, and potential reversal zones in a single window. Because the MACD on RSI Indicator integrates fast EMA, slow EMA, signal SMA, and a 5-period moving average, it provides a clear and visual representation of market conditions, making it useful for both beginners and advanced forex traders.
How the MACD on RSI Indicator Works
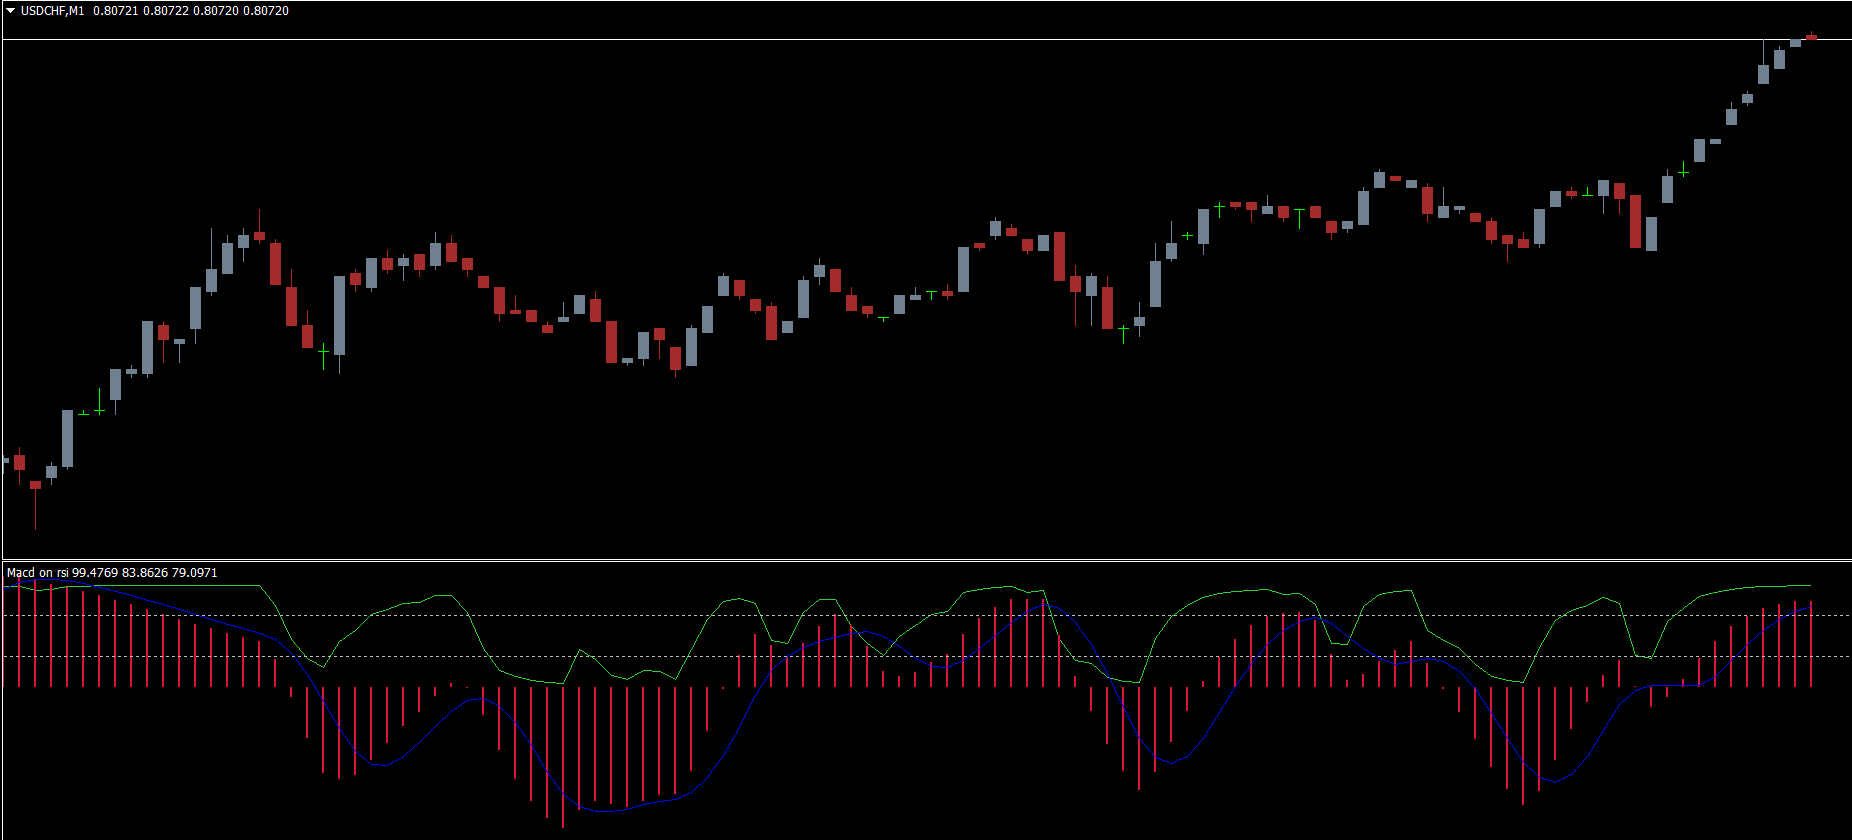
The indicator uses a combination of moving averages and oscillation levels to reveal market momentum. The fast EMA is displayed in green, while the slow EMA appears in blue. This color-coding allows traders to quickly identify shifts in Trend Strength and potential entry opportunities.
RSI-Based Overbought and Oversold Signals
The built-in RSI component enhances the MACD data by highlighting overbought and oversold zones:
Above 70 = Overbought zone
Below 30 = Oversold zone
When price reaches these extreme regions, traders can anticipate trend exhaustion or upcoming reversals, especially when combined with the direction of the EMAs.
MACD Bar Movement for Trend Confirmation
Unlike standard MACD histograms placed below the chart, the MACD on RSI Indicator draws bars directly on its panel to illustrate trend direction. Rising bars suggest bullish strength, while falling bars indicate bearish pressure. This visual approach makes it easier to interpret trend momentum at a glance.
Best Timeframes for the MACD on RSI Indicator
Although the indicator can be used across all timeframes, it performs exceptionally well on higher timeframes such as:
H4
Daily
Weekly
Longer timeframes reduce noise and false signals, giving traders more reliable and consistent momentum readings.
MACD on RSI Indicator BUY/SELL Signals
How to Identify a BUY Setup
For a long entry, traders should look for:
Bars in the oversold region (below the RSI 30 level).
Fast EMA below the slow EMA, signaling downward exhaustion.
However, even when these conditions appear, price may still move sideways or against the expected direction due to choppy market behavior. Therefore, traders should always wait for confirmation from Price Action, such as a bullish candle close or breakout.
How to Identify a SELL Setup
For a short entry, traders need:
Bars in the overbought zone (above RSI 70).
Slow EMA below the fast EMA, suggesting weakening bullish momentum.
As with BUY signals, sideways markets or consolidation can cause false breaks. Traders should wait for continued downward momentum before placing a SELL trade.
Why Traders Prefer the MACD on RSI Indicator
Combines two proven indicators into one tool
Filters out noise in low-quality price zones
Helps identify high-probability entry and exit points
Suitable for trend trading, swing trading, and momentum trading
Works well on all major forex pairs and metals
Conclusion
The MACD on RSI Indicator is a highly effective tool for analyzing trend direction, momentum shifts, and reversal areas. Its combination of MACD and RSI allows traders to make better decisions with greater confidence. If you want to enhance your strategy and access more premium trading tools, you can download the MACD on RSI Indicator for free at IndicatorForest.com.
FAQ
3 Downloads
Published:
Nov 19, 2025 22:49 PM
Category: