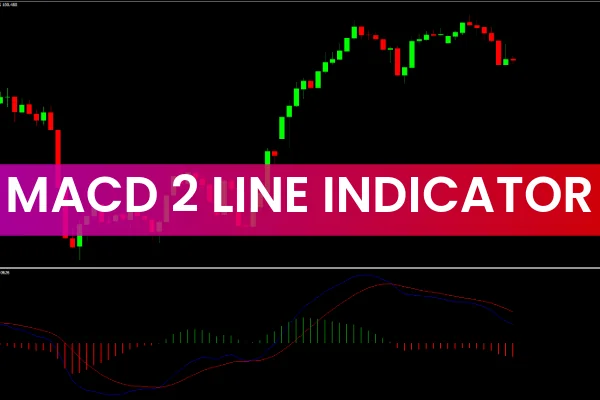
The MACD2Line Indicator for MT4 is a custom tool that enhances your trading by drawing two Exponential Moving Averages (EMA) and a volume histogram in a separate chart window. It includes a zero line dividing overbought and oversold zones, giving traders clear signals for potential reversals.
When the moving averages rise above the zero line, it suggests that a Trend Reversal downward may soon occur. Conversely, when the EMAs drop below the zero line, a possible upward reversal is expected.
Since the MACD2Line belongs to the oscillator family, it works best when market trends shift from bullish to bearish or vice versa. Whether you’re an intraday, swing, or long-term trader, this indicator adapts to your strategy.
Short-term traders benefit from increased entry points due to smaller EMA periods.
Long-term traders gain fewer but stronger entry signals by extending EMA periods.
By offering flexibility across trading styles, the MACD2Line indicator becomes a valuable component of any MT4 trading system.
Features of MACD2Line
While MetaTrader 4’s built-in MACD is powerful, the MACD2Line indicator introduces several enhancements for precision trading:
Dual EMAs (Fast and Slow):
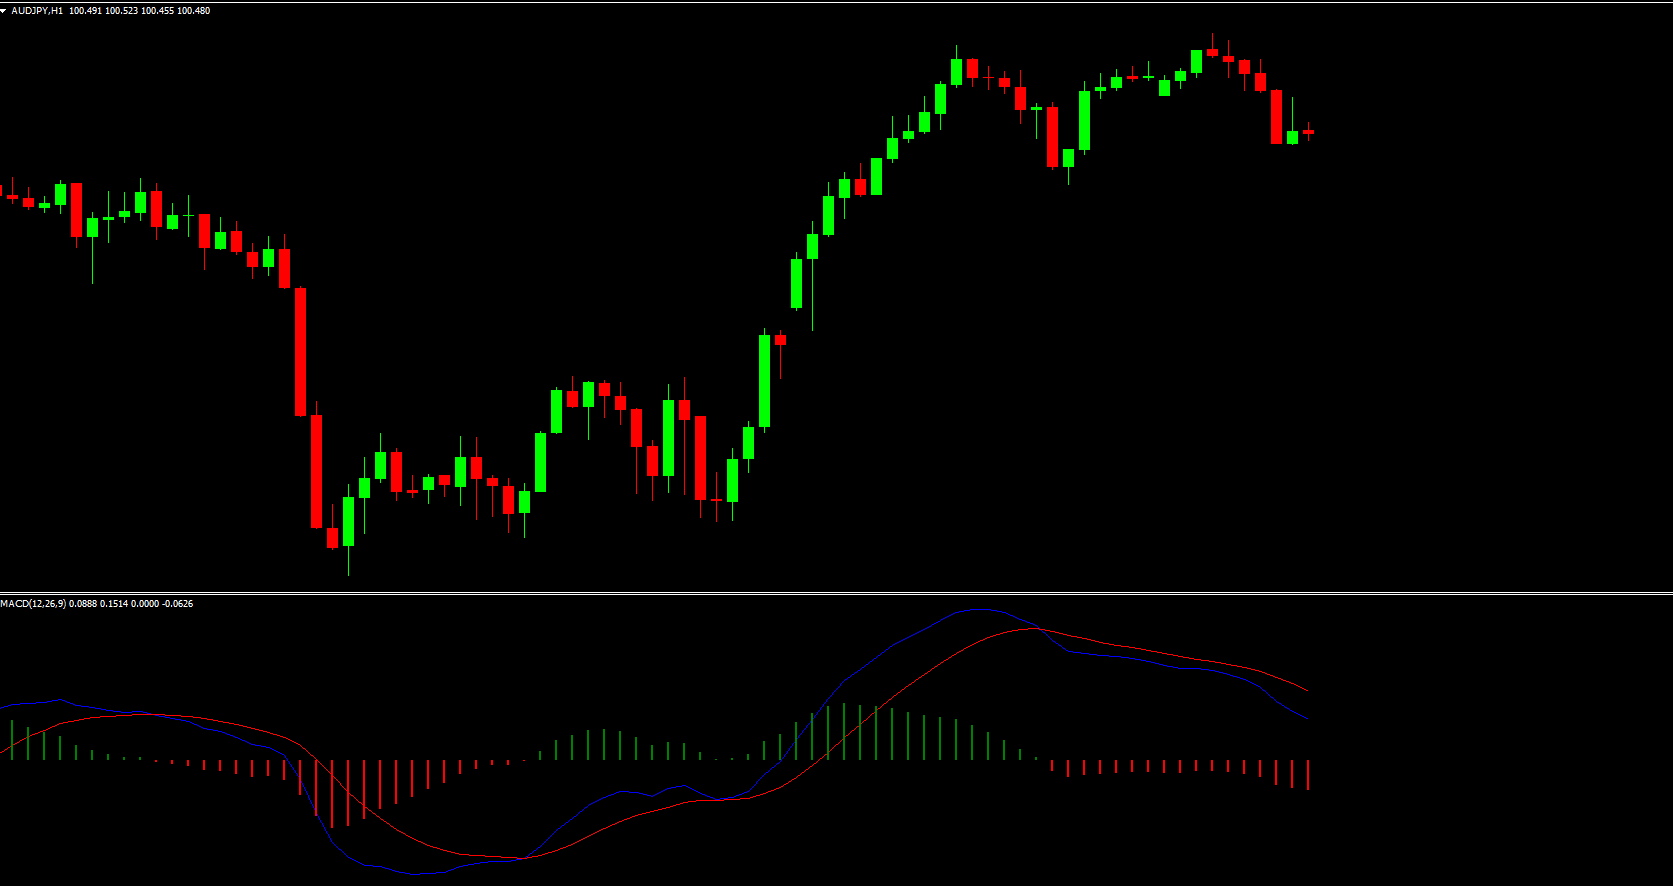
The indicator draws two differently colored EMAs—blue for the fast line and red for the slow line. Entry signals occur when these lines cross each other.
Color-coded Histogram:
The histogram features two colors:
Green indicates potential buying opportunities.
Red signals possible selling setups.
Zero Line Enhancement:
Unlike the standard MACD, the MACD2Line’s zero line serves as an additional confirmation signal. The histogram separates bullish and bearish volumes, improving trade accuracy.
Multiple Entry Opportunities:
The second moving average increases the number of high-probability trade entries without compromising reliability.
These improvements make the MACD2Line one of the most reliable free Forex indicators available on IndicatorForest.com.
Trading Signals and Alerts
The MACD2Line Indicator generates clear bullish and bearish signals, but combining it with technical analysis tools like trendlines enhances accuracy. For example, the AutoTrendLines indicator can help confirm trend direction.
Example of a Bearish Signal:
The EMAs move into the overbought zone.
The histogram turns red.
The fast EMA crosses below the slow EMA.
The trendline confirms a downward trend.
Traders can place a Stop Loss beyond the trendline to manage risk effectively.
Example of a Bullish Signal:
On a shorter timeframe like M15, when the EMAs cross upward and the histogram turns green, this indicates potential buying conditions.
The uptrend line remains unbroken.
The signal is confirmed by the crossover and histogram color.
The trade can be closed when the EMAs reach the overbought zone.
These signals work across multiple timeframes, offering flexible applications for all trading styles.
How to Use MACD2Line Effectively
Install the indicator on your MetaTrader 4 platform.
Combine it with trendlines or support/resistance analysis for confirmation.
Use EMA period adjustments based on your preferred trading strategy.
Monitor histogram color changes for quick entry and exit points.
By incorporating these steps, traders can significantly improve trend timing and trade accuracy.
Conclusion and Call-to-Action
The MACD2Line Indicator for MT4 is a powerful upgrade to the standard MACD oscillator. With dual EMAs, color-coded histograms, and clear overbought/oversold signals, it enhances every trader’s decision-making process.
Ready to enhance your Forex strategy?
Download the MACD2Line indicator for free today at IndicatorForest.com and explore more advanced tools for MetaTrader 4 and MetaTrader 5.
FAQ
8 Downloads
Published:
Nov 11, 2025 02:51 AM
Category: