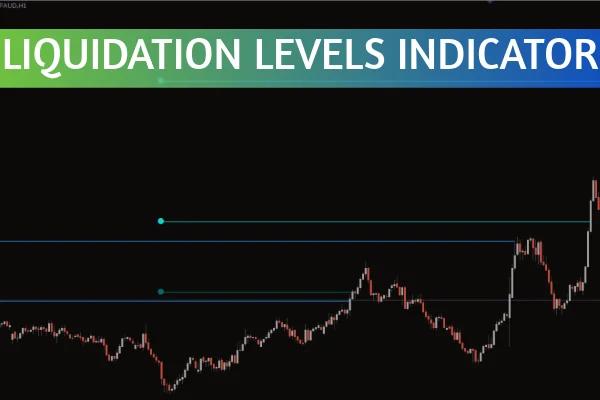
The Liquidation Levels Indicator from the LuxAlgo project offers traders a unique insight into where leveraged positions in the market might be liquidated. These liquidation zones often act as magnets for price movements, showing areas where traders using high leverage—such as 25x, 50x, or even 100x—are most vulnerable. Understanding these levels can give you a powerful edge, allowing you to anticipate market reactions before they happen.

At IndicatorForest.com, we explore indicators like this one that give traders real context behind market movements—not just signals, but reasons.
The LuxAlgo Liquidation Levels Indicator doesn’t just show random lines—it visualizes zones where liquidity pools form. These pools represent clusters of stop-losses and liquidation points from leveraged traders. When price approaches these zones, volatility often increases sharply as liquidations trigger a chain reaction of forced buying or selling.
In simple terms:
High liquidation levels = high volatility potential
Clustered levels = stronger magnet for price
Wiped-out leverage = new opportunities for reversals
By reading these levels correctly, traders can prepare for fakeouts, spikes, or reversals instead of getting caught on the wrong side.
In today’s crypto and forex markets, a large share of trading volume comes from leveraged positions. This makes liquidation data crucial. Price doesn’t move randomly—it seeks liquidity. When large groups of traders have stop-losses or liquidation points at the same level, those zones attract smart money.
The Liquidation Levels Indicator helps you see where that liquidity resides, providing clarity in chaotic markets. Traders use it to:
Identify potential reversal zones before price turns.
Avoid false breakouts caused by liquidation spikes.
Improve entry timing around key liquidity areas.
Understand market psychology through liquidation mapping.
Unlike traditional indicators that simply generate buy or sell arrows, the Liquidation Levels Indicator provides deeper context. It highlights the zones where leveraged traders may be forced out—creating opportunities for those who can anticipate the reaction.
As price nears these areas:
Long liquidation zones often signal potential upward bounces.
Short liquidation zones can indicate possible downward moves.
Clustered zones suggest imminent volatility or fakeouts.
When combined with other tools like LuxAlgo Premium Signals or Market Structure overlays, traders can form a multi-layered view of momentum and liquidity flow.
Here’s how professional traders incorporate the LuxAlgo Liquidation Levels Indicator into their setups:
Scalping & Day Trading – Use real-time liquidation levels to anticipate short-term spikes and avoid sudden wicks.
Swing Trading – Identify high-probability zones where the market may reverse after clearing liquidity.
Risk Management – Understand where most traders are likely to be liquidated and avoid clustering your stops near them.
This approach enhances situational awareness—helping traders think like smart money rather than follow it.
The Liquidation Levels Indicator from LuxAlgo is more than a technical overlay—it’s a psychological map of trader behavior. By exposing where high-leverage positions are most at risk, it helps you make smarter, data-driven trading decisions.
Whether you’re trading breakouts or catching reversals, this tool provides insight into the “why” behind every move. Add it to your toolkit and start viewing market structure from a liquidity-first perspective.
👉 Explore more trading tools and strategies at IndicatorForest.com and take your trading analysis to the next level.
Published:
Oct 21, 2025 15:16 PM
Category: