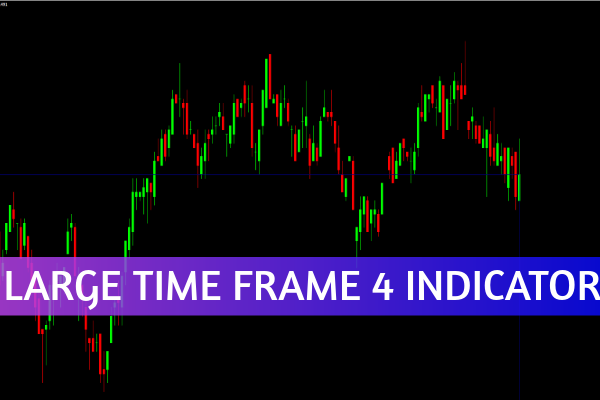
The Large Time Frame 104 Indicator for MT4 is a powerful MetaTrader 4 tool that helps traders visualize weekly (W1) candlesticks directly on smaller timeframes. Instead of switching back and forth between charts, traders can instantly view the weekly candle structure — including the wick, body, and overall formation — on intraday or swing trading charts.
This indicator doesn’t analyze trends automatically; however, it provides critical insights for technical analysis, allowing traders to see how weekly price movements influence shorter-term setups. By incorporating the Large Time Frame 104 Indicator, traders can refine their strategies and gain a deeper understanding of market structure.
The Large Time Frame 104 Indicator for MT4 is especially useful for day traders and swing traders. Since it displays the W1 candlestick pattern on lower timeframes, it offers a clear visual of the dominant market direction.
For example, if the indicator shows that recent weekly candles are bearish, traders may choose to prioritize short positions on smaller timeframes that align with this bias. This approach supports a top-down trading strategy, which many professional traders rely on to identify high-probability trade setups.
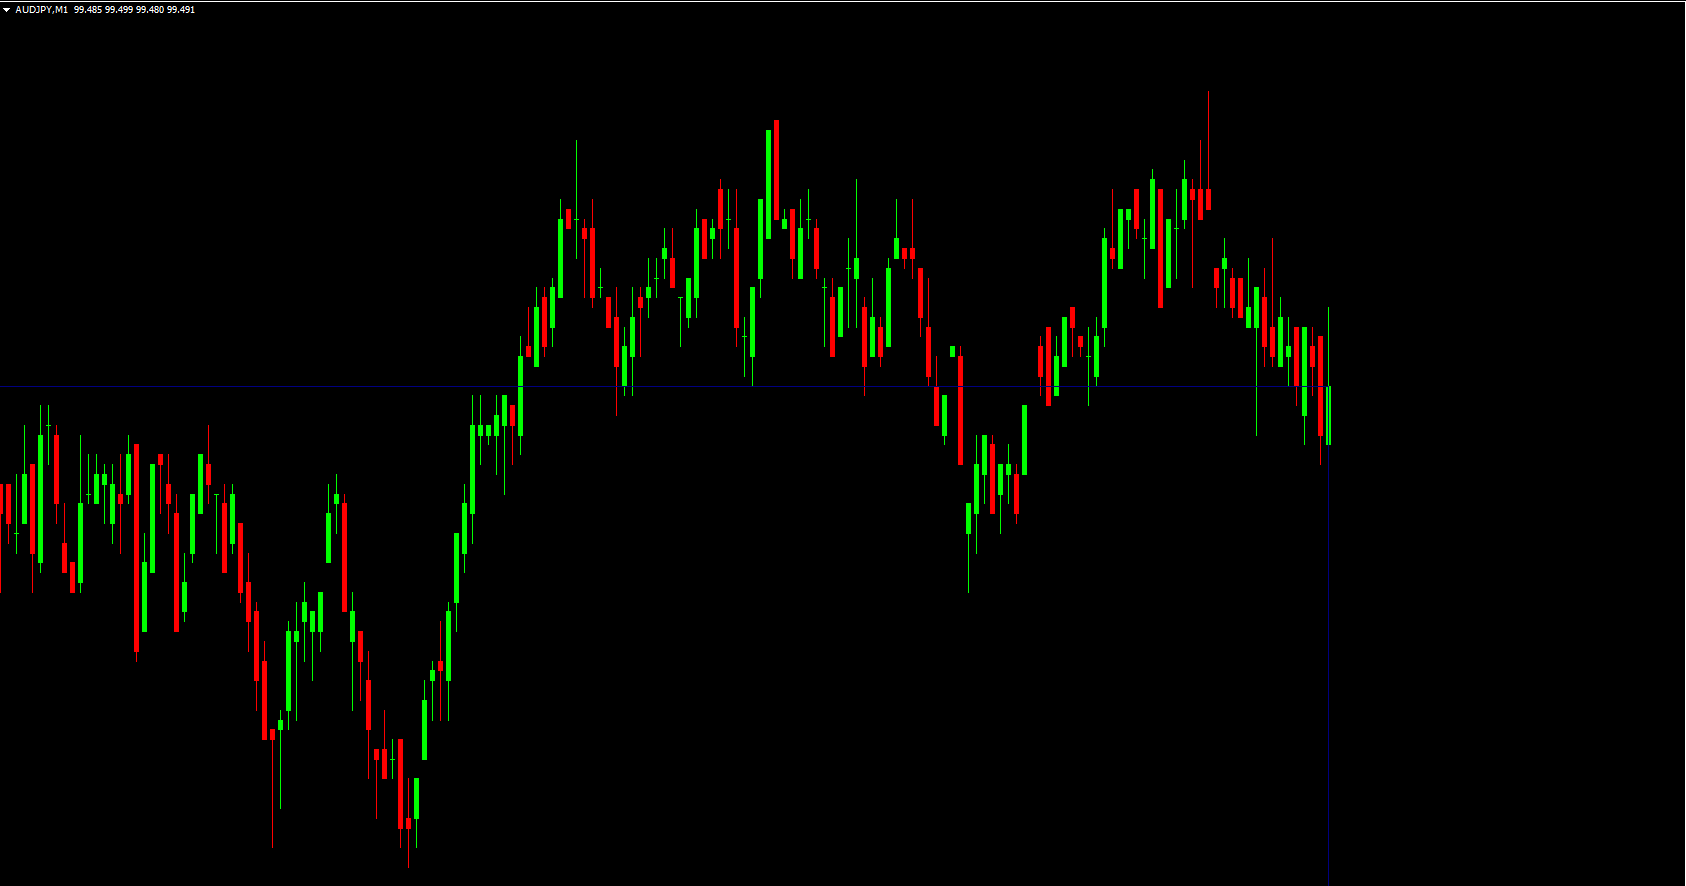
When installed, the Large Time Frame 104 Indicator for MT4 overlays weekly candlestick data onto any chosen lower timeframe chart, such as H1 or M30.
Bearish candles appear in navy color,
Bullish candles appear in maroon color.
This visual representation helps traders stay aligned with the higher timeframe trend, even when trading shorter-term movements.
For instance, on an EUR/USD H1 chart, if the weekly candle is bearish (as indicated by the navy color), traders might look for sell opportunities in alignment with that bias. This simple yet effective display helps reduce chart clutter and enhances the trader’s decision-making process.
The indicator simplifies top-down analysis by integrating higher-timeframe data directly into lower charts. No need to switch between charts constantly.
By knowing the weekly market direction, traders can make more informed entries and exits on lower timeframes.
The color-coded candle system makes it easier to identify market sentiment without complex indicators or overlays.
Traders focusing on short- to medium-term movements benefit most, as the weekly candle bias helps determine probable trade direction.
Using this indicator is straightforward:
Install it on your MetaTrader 4 platform.
Apply it to any chart and select your desired lower timeframe.
Observe the displayed weekly candlesticks for directional bias.
Align trades with the weekly trend (e.g., bearish weekly = look for sell setups).
For example, if the EUR/USD pair shows consecutive bearish weekly candles, it signals that market sentiment is negative. Intraday traders might then look for sell signals on M30 or H1 charts.
The Large Time Frame 104 Indicator for MT4 is a must-have tool for traders who want to integrate weekly timeframe analysis into their daily trading workflow. It’s simple, effective, and best of all — free to download.
Whether you’re a beginner looking to understand market structure or an experienced trader refining your top-down approach, this indicator can make a significant difference in how you view price action.
👉 Download the Large Time Frame 104 Indicator for MT4 today at IndicatorForest.com and take your technical analysis to the next level.
Published:
Oct 26, 2025 03:55 AM
Category: