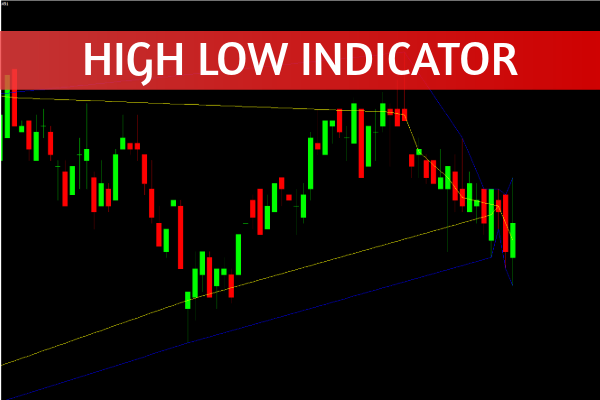
The High Low Indicator for MT4 is a powerful yet simple trading tool that helps identify potential breakout and continuation opportunities in the forex market. It consists of two dynamic bands — black and blue — that encapsulate the recent highs and lows of price movements. These bands serve as a visual guide to market bias, helping traders make informed decisions about whether to buy, sell, or wait.
Unlike more complex indicators, the High Low Indicator focuses on price action clarity, giving traders an easy way to spot momentum shifts and potential entry zones. Whether you are a beginner or an experienced trader, this tool can add structure to your analysis and boost your confidence when identifying trade setups.
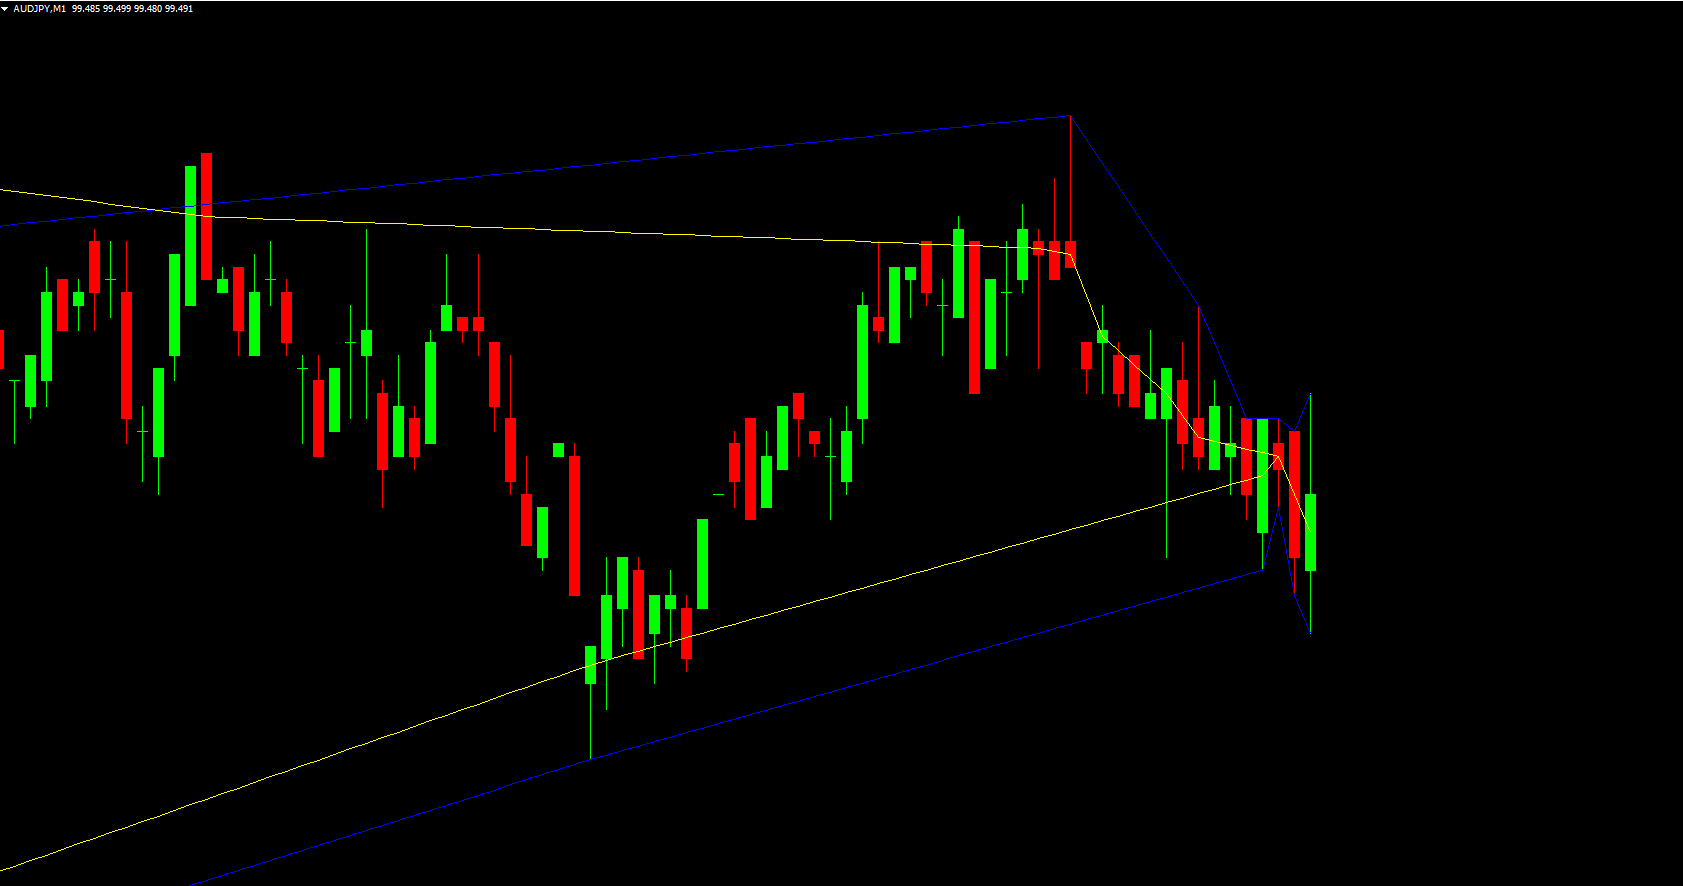
The two colored bands (black and blue) move along with the price, forming upper and lower envelopes around it. These represent the highest highs and lowest lows within a specific period.
When the bands slope upward, the market shows a bullish bias.
When the bands slope downward, the market exhibits a bearish phase.
This directional bias helps traders understand whether to look for buying or selling opportunities.
The High Low Indicator for MT4 can be applied in two main ways:
When the bands are narrow, it signals a period of market consolidation. Narrow bands often precede strong price movements — this is where breakout traders can find opportunity.
Wait for a breakout candle to close above or below the bands.
Confirm that the direction of the bands shifts in the direction of the breakout.
Enter the trade once the move is confirmed and the bands start expanding.
This setup works best on higher timeframes where false breakouts are less frequent. Traders often combine this indicator with volume analysis or momentum oscillators to strengthen confirmation.
When the bands are wide, the market is trending strongly. In this situation, traders can look for continuation setups:
In a downtrend, short entries can be made when price touches the upper band.
In an uptrend, long entries can be made when price touches the lower band.
This technique allows traders to ride the trend by entering pullbacks rather than chasing price. The simplicity of this setup makes it appealing to both manual and algorithmic traders.
Identify the trend first. Always confirm market direction before placing trades.
Use multiple timeframes. Check higher timeframes to ensure consistency with your trading bias.
Combine with other tools. Add indicators like Moving Averages or RSI for confirmation.
Backtest before live trading. As with any trading strategy, practice on a demo account to refine your entries and exits.
The High Low Indicator for MT4 is often compared to Bollinger Bands, and rightly so — both use price envelopes to define market boundaries. However, while Bollinger Bands rely on standard deviation, the High Low Indicator simply tracks the extreme price levels. This makes it easier to interpret and less affected by volatility spikes.
For traders who prefer clarity and simplicity, the High Low Indicator provides a more direct approach to understanding price behavior without additional statistical calculations.
The High Low Indicator for MT4 is a straightforward yet effective tool that helps traders identify both breakout and continuation opportunities. By understanding how the bands reflect market bias, traders can gain better insight into market conditions and improve their decision-making.
To explore more advanced forex indicators, strategies, and trading tools, visit IndicatorForest.com — your trusted source for MT4 and MT5 resources.
Published:
Oct 26, 2025 09:19 AM
Category: