The Bands Fibo True Indicator for MT4 is an innovative forex tool that integrates Fibonacci ratios with the traditional Bollinger Bands concept. Instead of relying on standard deviation, this indicator uses Fibonacci levels (1.618, 2.618, and 4.236) to calculate and plot the upper and lower bands. This fusion of two powerful analytical methods offers traders a more dynamic view of market volatility and potential reversal zones.

At IndicatorForest.com, you can explore and download this indicator to enhance your technical trading strategies.
How the Bands Fibo True Indicator Works
The Bands Fibo True Indicator operates on similar rules as Bollinger Bands, identifying overbought and oversold zones based on price movements relative to the bands. However, by applying Fibonacci ratios, the indicator fine-tunes these zones for more accurate entry and exit points.
Fibonacci Levels Used
1.618 – Represents the first potential reversal area.
2.618 – Marks stronger extension or correction levels.
4.236 – Highlights extreme market conditions and potential turning points.
These levels allow traders to anticipate reversals more precisely and adjust risk management strategies accordingly.
Bands Fibo True Indicator Trading Strategy
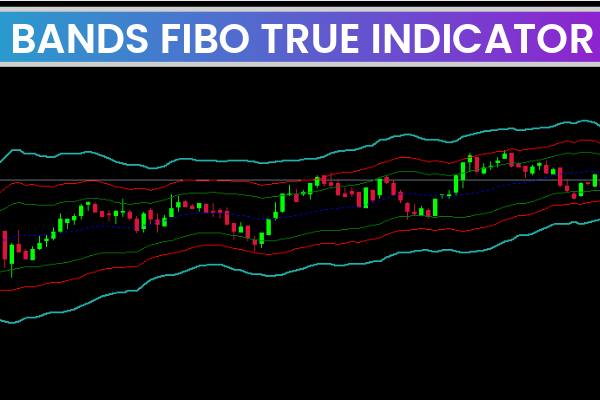
The indicator plots three upper and three lower bands on the chart:
Outer light green bands represent the 4.236 levels.
Middle red bands show the 2.618 levels.
Inner green bands mark the 1.618 levels.
Bearish Setup (Sell Trade)
When the price touches the outer or middle upper band, it signals an overbought condition. Traders look for a price reversal — a candle closing below the inner band confirms bearish momentum.
Entry: After confirmation below the inner band.
Stop Loss: Above the previous swing high.
Take Profit: At or near the opposite lower band.
Bullish Setup (Buy Trade)
Conversely, if the price touches the outer or middle lower band, it signals oversold conditions. A bullish reversal is confirmed when the price closes above the inner band.
Entry: After confirmation above the inner band.
Stop Loss: Below the previous swing low.
Take Profit: At or near the opposite upper band.
This Fibonacci-based Bollinger strategy helps traders avoid false signals while maintaining clear stop and target levels.
Benefits of Using Bands Fibo True Indicator
Enhanced Accuracy: Fibonacci ratios provide stronger precision than traditional deviation-based bands.
Versatile Application: Works on all timeframes and forex pairs.
Compatible with Automated Trading: The indicator’s logic is suitable for integration into EA (Expert Advisors).
Visually Intuitive: The color-coded bands make interpretation easy for both beginners and experienced traders.
By combining Fibonacci mathematics with volatility-based analysis, the indicator gives a unique edge in both ranging and trending markets.
Tips for Maximizing Results
Use this indicator alongside RSI or MACD for confirmation of entry signals.
Avoid trading solely on band touches—always wait for Price Action confirmation.
Backtest the settings on a demo account before applying them to live trading.
For more advanced strategies and downloads, visit IndicatorForest.com — your trusted resource for the best MT4 and MT5 forex indicators.
Conclusion
The Bands Fibo True Indicator for MT4 transforms the classic Bollinger Bands by incorporating Fibonacci ratios, resulting in a more adaptive and mathematically robust trading tool. Whether you are a beginner learning band-based strategies or an expert looking for precision entry signals, this indicator is an excellent addition to your trading toolkit.
2 Downloads
Last Update:
Nov 03, 2025 15:23 PM
Published:
Nov 03, 2025 14:27 PM
Category: