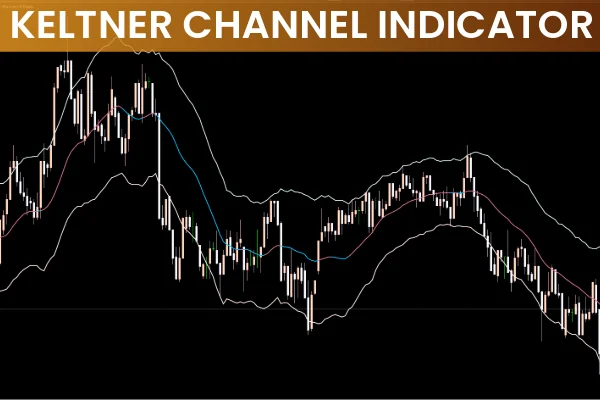
If you’ve ever struggled to determine whether the market is trending up or down, you’re not alone. Many traders hear the advice “always trade with the trend”, yet still find it difficult to identify real market direction. The Keltner Channel (KC) Indicator for MT5 solves this problem by giving a clear, visual representation of trend direction, volatility, and potential breakout opportunities.
What Is the Keltner Channel Indicator on MT5?
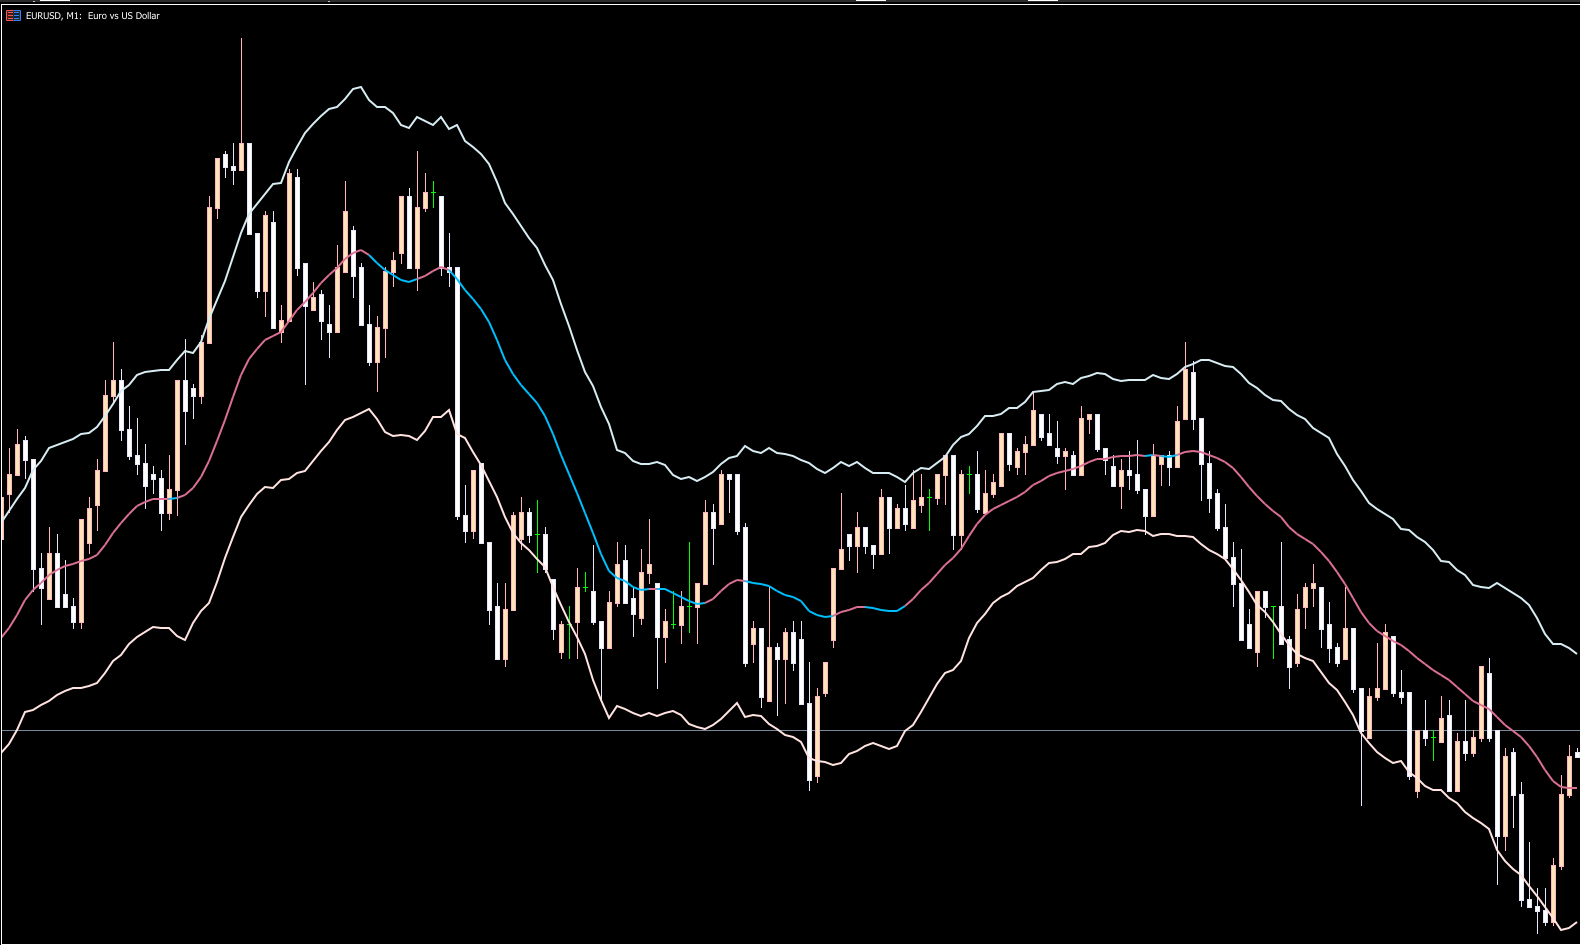
The Keltner Channel is a volatility-based trading indicator composed of three bands:
Upper Band
Lower Band
Middle Band (the EMA line)
These bands expand and contract based on volatility and typically contain most price movement within them.
Traders use the Keltner Channel to:
Identify market trends
Detect trend reversals
Spot breakout opportunities
Determine market volatility
Unlike Bollinger Bands—one of its closest rivals—the Keltner Channel reacts smoother and produces fewer false breakout signals, thanks to its special calculation formula.
Why the Keltner Channel Is So Effective
Accurate Trend Detection
When the entire channel tilts upward, the market is in an uptrend.
When the channel tilts downward, it signals a downtrend.
This makes it extremely beginner-friendly for identifying market direction.
Early Reversal Detection
Because the channel envelopes Price Action, breaks outside the bands can signal an early shift in momentum—ideal for reversal traders.
Fewer False Breakouts
The Keltner Channel uses ATR-based volatility rather than standard deviation (like Bollinger Bands).
This makes it less sensitive to random price spikes and more resistant to false trading signals.
Adjustable Sensitivity
You can fine-tune how aggressively the channel reacts to the market by adjusting:
EMA period
ATR period
Multiplier
This allows trend traders, scalpers, swing traders, and breakout traders to customize the indicator to their style.
How the Keltner Channel Works (Formula Breakdown)
The KC indicator uses EMA (Exponential Moving Average) and ATR (Average True Range) to calculate its bands:
Upper Band = EMA + (Multiplier × ATR)
Lower Band = EMA – (Multiplier × ATR)
Middle Band = EMA
Default Settings on MT5
EMA Period: 20
ATR Period: 10
Multiplier: 2
A higher EMA makes the channel slower and smoother. A lower EMA makes it react more quickly.
A higher multiplier widens the bands; a lower multiplier narrows them.
How to Trade Using the Keltner Channel
Breakout Trading Strategy
The Keltner Channel is excellent for breakout trades.
Buy Signal: Price closes above the upper band
Sell Signal: Price closes below the lower band
Once the breakout occurs, traders enter in the direction of the break and hold until the opposite signal appears.
Stop-Loss Placement
To protect against false breakouts:
Buy Trades: Place SL below the previous swing low
Sell Trades: Place SL above the previous swing high
This keeps stop-loss placement aligned with real price structure.
Who Should Use the Keltner Channel Indicator?
The Keltner Channel is great for:
Beginner traders struggling to identify trends
Trend-followers who want clean signals
Trend Reversal traders spotting early shifts
Breakout traders using volatility expansion
Swing and intraday traders who rely on dynamic support & resistance
Its simple visual layout makes it one of the best MT5 indicators for learning Market Structure.
Conclusion
The Keltner Channel Indicator for MT5 is a powerful, easy-to-use tool that helps traders identify trends, breakouts, and potential reversals. Its EMA- and ATR-based formula makes it smoother, more stable, and more reliable than many alternative indicators. Whether you're a beginner learning market structure or an advanced trader fine-tuning your strategy, the Keltner Channel is a must-have tool in your MT5 toolbox.
FAQ
1 Download
Published:
Nov 29, 2025 23:50 PM
Category: