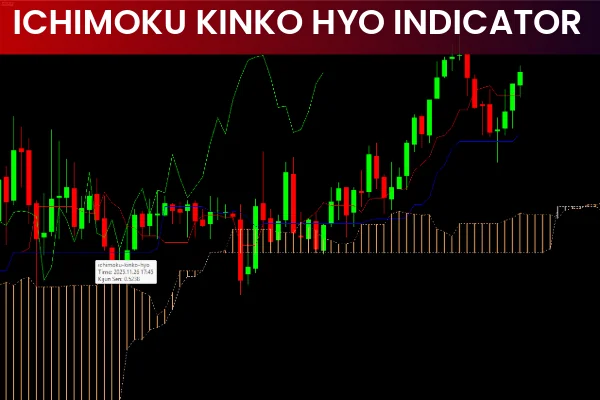
The Ichimoku Kinko Hyo Indicator, commonly called Ichimoku, is one of the most popular Forex trading tools due to its ability to predict trends and highlight dynamic Support And Resistance levels. Developed in Japan decades ago, its name translates to “A Glance at the Chart in Equilibrium”, emphasizing its goal to provide a quick overview of market conditions.
Although its initial appearance may seem complex, understanding each component allows traders to make informed trading decisions for trend trading, Trend Continuation, and support/resistance analysis.
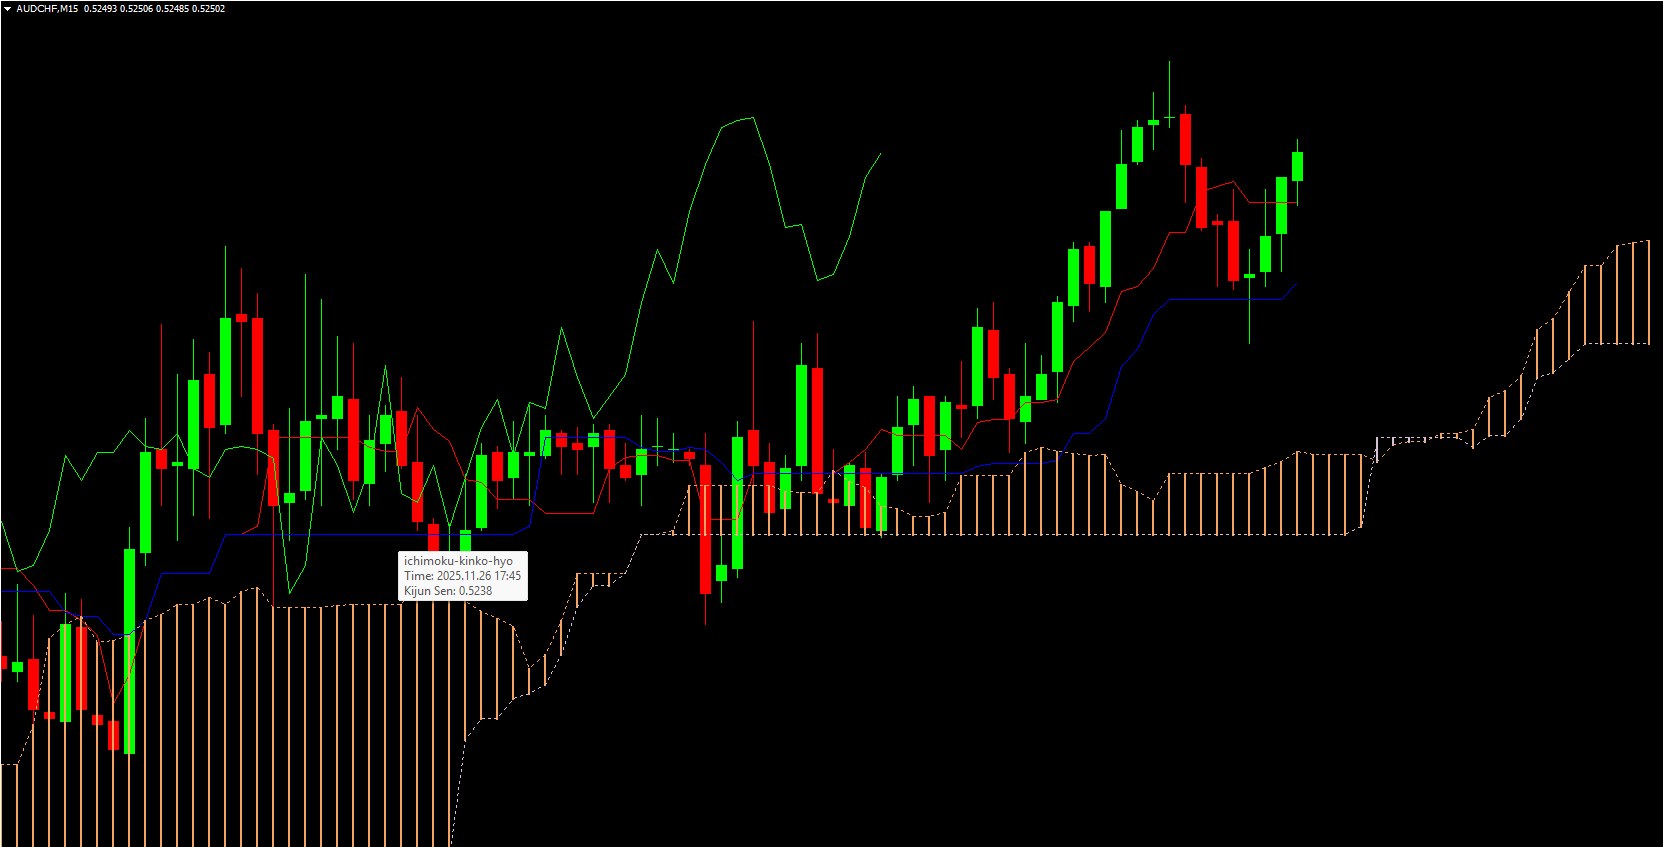
Components of the Ichimoku Indicator
The Ichimoku consists of five key components, each providing unique insights into market behavior:
Tenkan Sen (Conversion Line)
Red line calculated as the average of the highest high and lowest low over the last 9 periods.
Indicates short-term market trend and potential reversal points.
Kijun Sen (Base Line)
Blue line calculated as the average of the highest high and lowest low over the last 26 periods.
Represents medium-term trend and acts as a support/resistance line.
Senkou Span A (Leading Span A)
One boundary of the Ichimoku cloud.
Average of Tenkan Sen and Kijun Sen, plotted 26 periods ahead.
Shows future potential support/resistance levels.
Senkou Span B (Leading Span B)
Second boundary of the cloud, calculated from the average of the highest high and lowest low over the last 52 periods, plotted 26 periods ahead.
The cloud formed by Span A and Span B identifies Trend Strength and direction.
Chikou Span (Lagging Line)
Closing price plotted 26 periods behind.
Confirms trend direction and momentum.
How to Use the Ichimoku Indicator
Trend Trading
When price is above the cloud, the market is bullish; when price is below the cloud, the market is bearish.
The Chikou Span helps confirm trend direction: if it is above past prices, the trend is bullish, and vice versa.
Trend Continuation Signals
A Tenkan Sen crossover Kijun Sen in the direction of the trend signals trend continuation.
Example: Tenkan crossing Kijun upward while the cloud is bullish suggests a potential buy opportunity.
Entry points can be taken at these crossover moments for effective trend-following trades.
Support and Resistance Levels
The Ichimoku cloud (Senkou Span A and B) acts as dynamic support and resistance.
Price retracements to the cloud often offer high-probability entry points.
Who Can Use the Ichimoku Indicator?
Beginners: Learn trend and support/resistance analysis in one glance.
Advanced Traders: Combine with other indicators for sophisticated strategies.
Trend Traders: Identify strong trends and continuation points.
Swing Traders: Spot retracements and reversals for optimal entries.
Note: For best results, the Ichimoku Indicator should not be used in isolation. Combine it with volume indicators, oscillators, or Price Action strategies.
Advantages of the Ichimoku Indicator
Comprehensive Analysis: Provides trend direction, momentum, and support/resistance levels in one indicator.
Multi-Timeframe Utility: Works on intraday, daily, weekly, and monthly charts.
Trend and Continuation Signals: Highlights potential trade entries and exits efficiently.
Suitable for Any Trading Style: Works for Scalping, day trading, swing trading, and long-term strategies.
Conclusion
The Ichimoku Indicator is a powerful tool for Forex traders seeking a complete market overview at a glance. By understanding the Tenkan Sen, Kijun Sen, Senkou Span A/B, and Chikou Span, traders can identify trends, continuation points, and key support/resistance zones effectively.
Whether you are a beginner or an experienced trader, the Ichimoku indicator enhances trading decisions and complements any Forex strategy.
Download the Ichimoku Indicator for MT4/MT5 from IndicatorForest.com and gain a clear edge in trend trading today.
FAQ
1 Download
Published:
Nov 27, 2025 02:34 AM
Category: