The Ichimoku Trend Monitor is designed to work seamlessly with the Ichimoku Kinko Hyo indicator, providing a structured, easy-to-read visualization of market trends. With a single glance, you can determine trend directions across all timeframes on your chart. This indicator is especially helpful for traders who prefer a clean, clutter-free trading interface without interfering with candlestick patterns.
Key Benefits
Multi-Timeframe Trend Analysis: See the trend across all chart timeframes instantly.
Supports All Trading Styles: Works for Scalping, day trading, and swing trading.
Minimal Chart Clutter: Provides clear trend signals without interfering with candlesticks.
Suitable for All Traders: Novices and professionals alike benefit from its straightforward design.
How the Ichimoku Trend Monitor Indicator Works
The indicator scans potential trend directions and evaluates several market variables such as:
Support And Resistance Levels
Market Momentum
Trend Bias
Other Price Action Signals
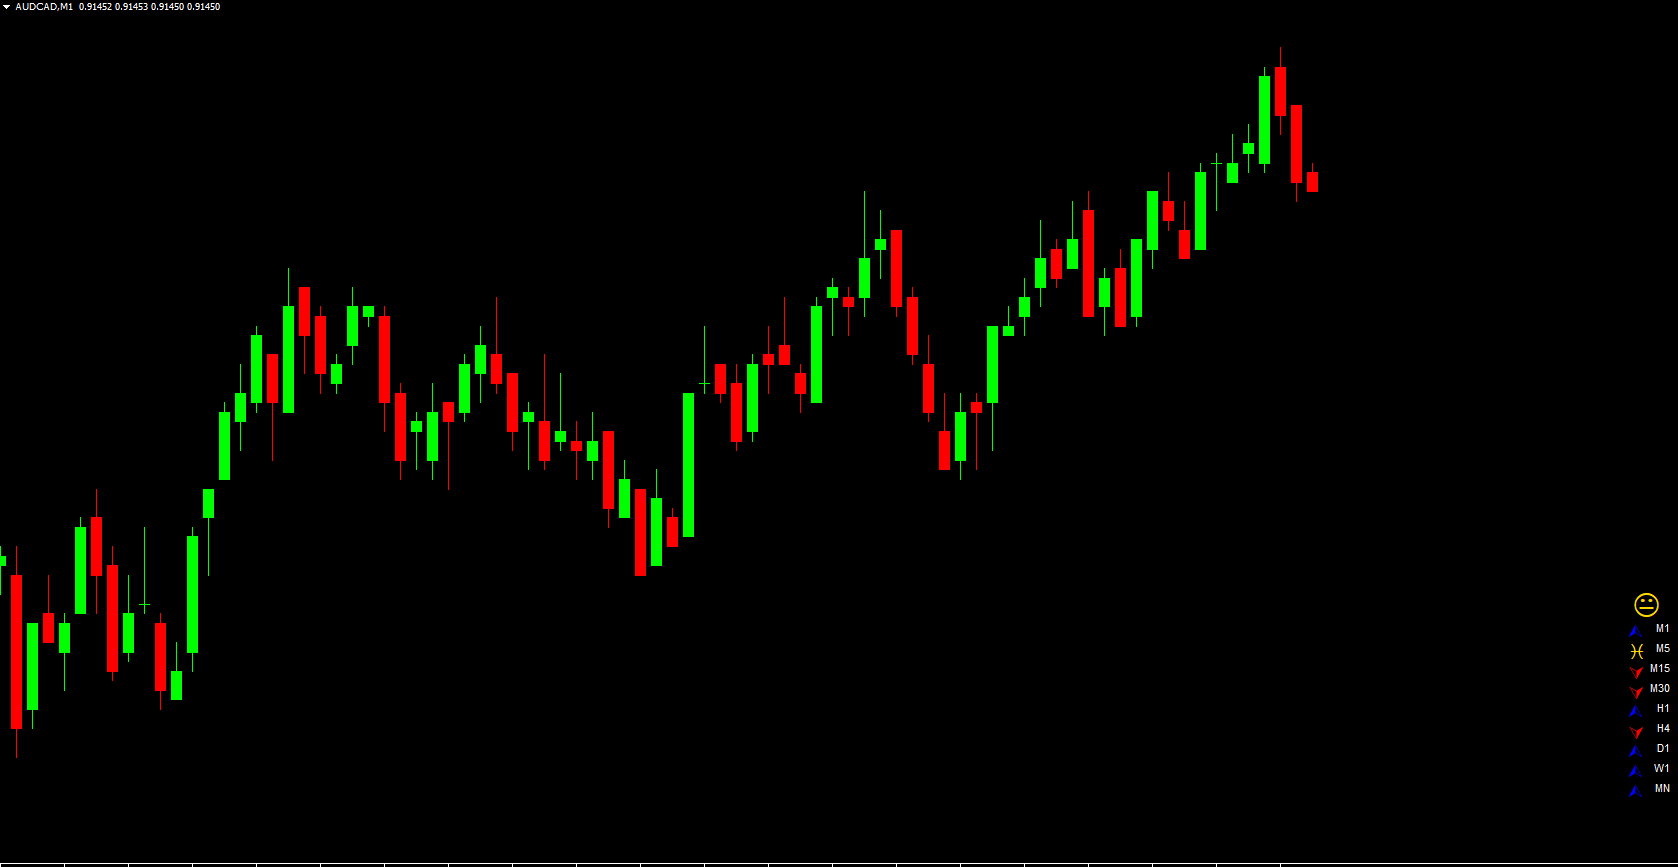
It then paints three types of trend signals:
BLUE arrow: Indicates an upward trend (BUY).
RED arrow: Indicates a downward trend (SELL).
YELLOW arrow: No clear trend detected.
This color-coded system allows traders to quickly confirm technical setups. For example, if your analysis predicts a bullish move and the indicator displays a BLUE arrow, your confidence in entering a long trade increases significantly.
Recommended Time Frames
Signals generated on higher timeframes (H1 and above) are more reliable because these charts better reflect the overall market direction. Lower timeframes may generate more noise, so for trend confirmation, it’s best to focus on H1, H4, and D1 charts.
How to Trade with the Ichimoku Trend Monitor Indicator
Attach the indicator to your chosen currency pair chart in MT4.
Observe the trend signals across all timeframes.
Use the arrows to confirm your trade setups:
BLUE arrow: Enter long trades.
RED arrow: Enter short trades.
YELLOW arrow: Avoid trades or wait for confirmation.
Combine with price action, candlestick patterns, or other Ichimoku-based indicators for additional accuracy.
The indicator integrates well with other tools like the Ichimoku Kinko Hyo System Indicator and Virtual Trade Monitor Indicator, enhancing your market view and trade management.
Pros and Cons of the Ichimoku Trend Monitor Indicator
Pros:
Multi-timeframe trend visualization
Easy to use for beginners and experts
Clean chart interface with minimal clutter
Free MT4 download
Cons:
Works best in trending markets; less effective in choppy conditions
Signals on lower timeframes can be less reliable
Conclusion
The Ichimoku Trend Monitor Indicator for MT4 is a versatile tool that provides traders with clear insights into market trends across multiple timeframes. Its integration with the Ichimoku Kinko Hyo indicator makes it especially effective for identifying trend direction, momentum, and support/resistance levels. Free to download, it’s suitable for scalping, day trading, or swing trading.
To further strengthen your trading strategy, consider exploring our article on the most liquid currency pairs, which complements multi-timeframe trend monitoring perfectly. Visit IndicatorForest.com to download the Ichimoku Trend Monitor Indicator today and start trading with confidence.
FAQ
16 Downloads
Published:
Nov 11, 2025 13:31 PM
Category: