The i-HighLow Indicator for MT5 is a smart technical analysis tool that continuously tracks the highest and lowest price points on your chart to reveal breakout and swing trading opportunities.
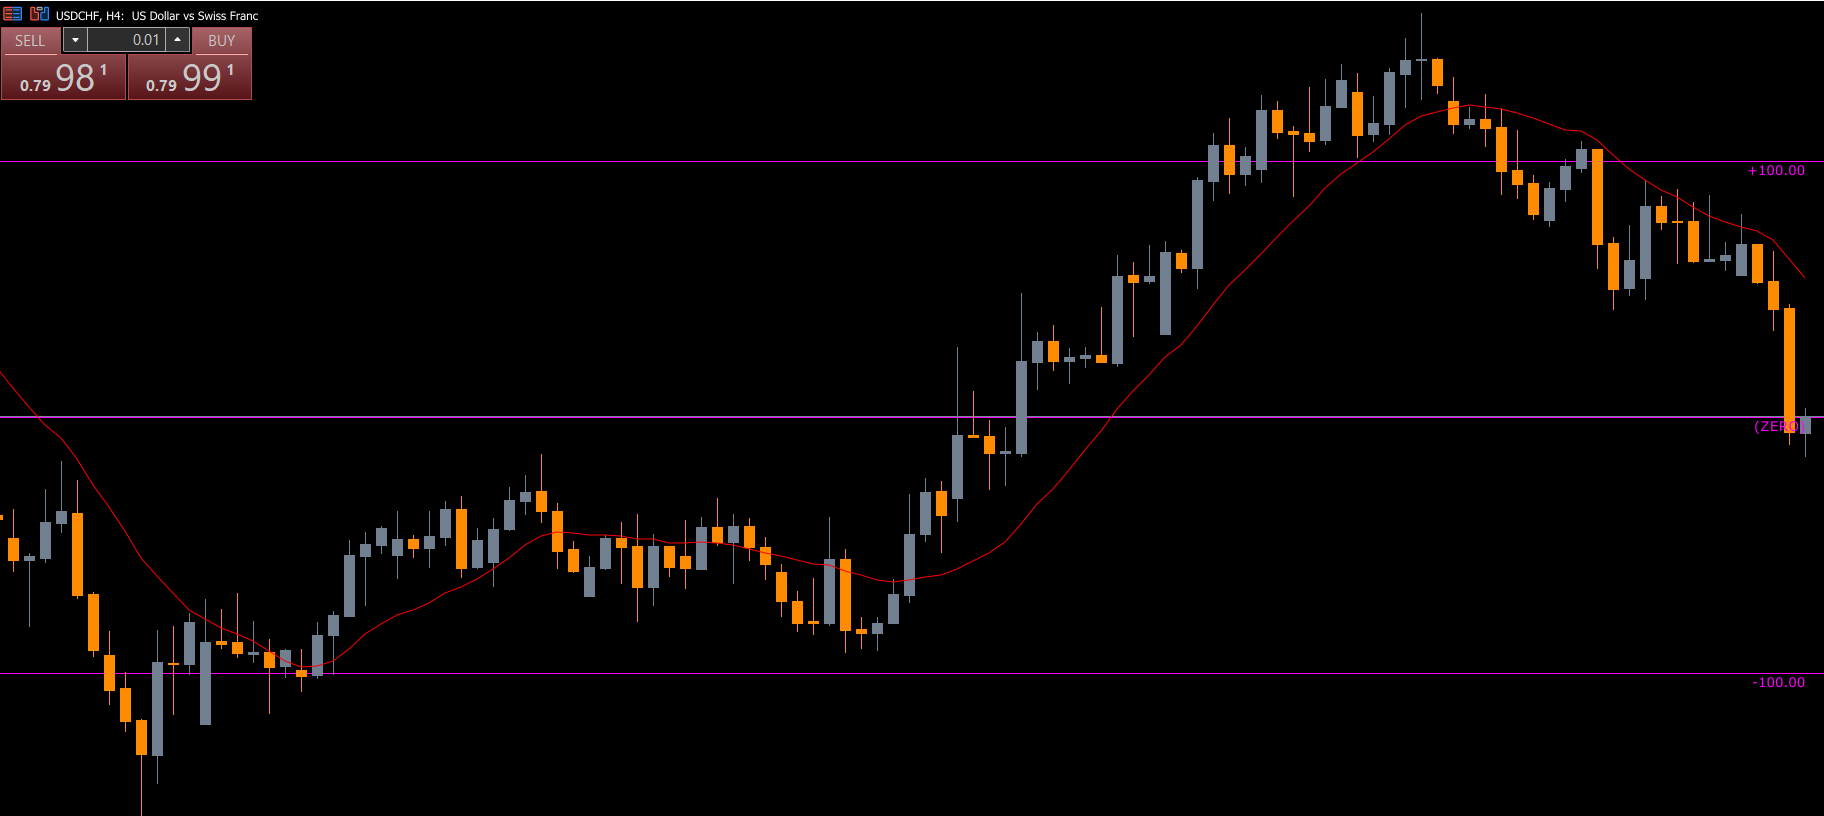
By connecting these highs and lows, the indicator helps traders identify trend channels, Support And Resistance zones, and potential market reversals. It’s ideal for traders who rely on Price Action analysis, as it visually maps recent market ranges and highlights where momentum shifts might occur.
The indicator works across all timeframes, making it suitable for Scalping, day trading, or swing trading strategies. It can also complement other tools like RSI, MACD, or Fibonacci retracement indicators.
How the i-HighLow Indicator Works
The i-HighLow indicator plots three main bands on your chart:
Upper Band – connects the recent price highs, acting as a resistance zone.
Lower Band – connects the price lows, forming a support zone.
Middle Band – represents the average of the highs and lows, serving as a neutral or balance level.
These levels visually define the current price range, allowing traders to assess whether the market is trending, consolidating, or preparing for a breakout.
Because the indicator updates in real time, it helps track price volatility and potential reversal areas as the session unfolds.
How to Trade With the i-HighLow Indicator for MT5
The i-HighLow indicator can be used in various trading conditions — both ranging and trending markets. Here’s how to interpret its signals:
Buy Setup (Bullish Reversal)
Wait for price to reject the lower band (support zone).
Confirm rejection with a bullish candle or long lower wick.
Enter a buy trade after a breakout above the candle high.
Stop Loss: place just below the recent swing low or lower band.
Take Profit: near the middle or upper band.
You can add more long positions if the price continues to reject the lower band or sustains above the middle band.
Sell Setup (Bearish Reversal)
When price tests and rejects the upper band, it signals resistance.
Confirm rejection with a bearish candlestick pattern.
Enter a sell trade once the price breaks below the candle low.
Stop Loss: just above the resistance zone (upper band).
Take Profit: target the middle or lower band.
Breakout Trading Strategy
If the market consolidates between the high and low bands, the i-HighLow indicator can outline a range breakout setup:
Buy: when price breaks above the recent high (upper band).
Sell: when price drops below the recent low (lower band).
This strategy works best when combined with volume confirmation or momentum indicators like MACD or Stochastic Oscillator.
Advantages of the i-HighLow Indicator
Identifies key reversal zones
Works across all MT5 timeframes
Helps confirm support/resistance levels
Suitable for breakout, trend, or range trading
Can be used alongside any technical strategy
Conclusion
The i-HighLow Indicator for MT5 is a highly flexible technical tool that allows traders to visualize the key highs and lows of the market. It’s perfect for detecting potential reversals, breakouts, and price ranges, helping traders plan entries and exits more effectively.
Although it doesn’t generate direct buy/sell arrows, it acts as an essential price structure guide for both beginner and professional traders. Whether you trade forex or stocks, this indicator can enhance your analysis and improve your ability to interpret market behavior.
📥 Download the i-HighLow Indicator for MT5 for free and start using it to strengthen your daily trading decisions.
FAQ
Published:
Nov 11, 2025 11:36 AM
Category: