If you have been trading the Forex market for any length of time, you are probably familiar with the Moving Average (MA) indicator. The Mega Trend Indicator for MT5 is an improved and more advanced version of the traditional MA indicator. It not only smooths price fluctuations but also identifies strong trend reversal points, helping traders capture profitable entries and exits with higher accuracy.

Unlike a basic moving average, which simply follows Price Action, the Mega Trend Indicator adapts dynamically to market conditions. This allows traders to use it effectively for trend trading, reversal strategies, and price action analysis.
About the Mega Trend Indicator
As mentioned earlier, the Mega Trend Indicator is a variant of the moving average that shows ideal reversal zones. The default period setting is 144, which is optimized for identifying long-term price movements. However, traders who focus on shorter timeframes such as M5 or M15 can adjust the period to get faster signals.
You can use this indicator on any time frame—from one minute (M1) charts for Scalping to monthly (MN) charts for position trading. Its versatility makes it an excellent tool for both beginner and professional traders.
The indicator is ideal for:
Trend trading: Following long-term market movements.
Reversal trading: Spotting key turning points.
Scalping and intraday trading: Quick entries and exits based on color changes.
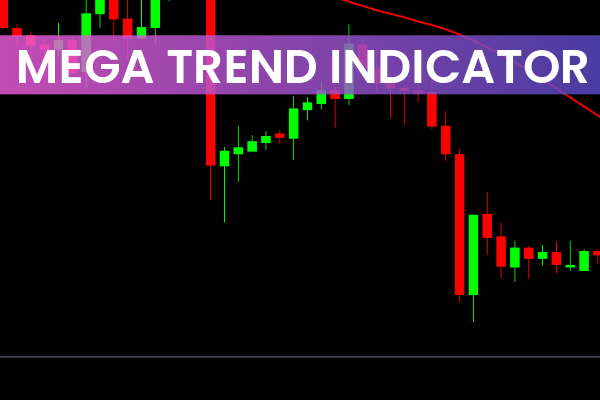
How the Mega Trend Indicator Works
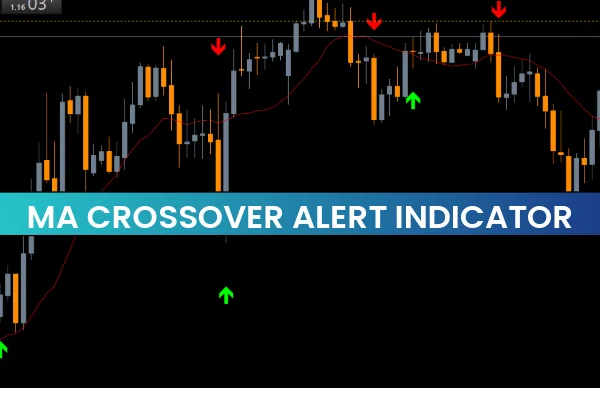
The Mega Trend Indicator for MT5 is straightforward yet powerful. It uses color-coded lines to indicate the direction of the market.
Blue Line: Indicates a bullish trend (buy signal).
Red Line: Indicates a bearish trend (sell signal).
This color transition system makes it easy for traders to identify market momentum without interpreting complex chart patterns or multiple indicators.
Opening Buy Positions
A buy signal occurs when the Mega Trend line changes from red to blue.
Entry: When the color turns blue.
Stop Loss: Place it near the most recent support level.
Exit: When the line turns red again.
Opening Sell Positions
A sell signal is generated when the line changes from blue to red.
Entry: When the color turns red.
Stop Loss: Place it above the latest resistance level.
Exit: When the line turns blue again.
Example Scenario
Consider the CHF/JPY H1 chart. The Mega Trend Indicator shows a downward trend beginning on December 6th, where the line turns red around the 168.00 level. Later, when the line changes to blue near 164.00, a strong reversal occurs. This provides an ideal entry point for a buy trade.
In this scenario, the indicator accurately predicted a 50-point upward movement following the color change. Such precision makes the Mega Trend Indicator a reliable component for any trading strategy.
Why Traders Love the Mega Trend Indicator
Simplicity: Easy color-coded visual signals.
Accuracy: Smooths out market noise to show true trend direction.
Versatility: Works on any currency pair, time frame, or asset.
User-Friendly: Perfect for both beginners and experienced traders.
You don’t need to spend hours analyzing multiple indicators. The Mega Trend does the heavy lifting, allowing you to focus on execution and money management.
How to Use the Mega Trend Indicator Effectively
Combine with other tools: Use alongside RSI or MACD for confirmation.
Adjust the period: Shorter settings (like 50 or 72) for fast markets; longer (like 200) for stable trends.
Practice on a demo account: Test different configurations before going live.
Stay disciplined: Follow your entry and exit rules consistently.
Final Thoughts
The Mega Trend Indicator for MT5 simplifies technical trading by transforming moving average logic into easy visual cues. Whether you are scalping or holding long-term positions, this tool helps you spot high-probability setups quickly.
Start enhancing your trading strategy today—download the Mega Trend Indicator for MT5 from IndicatorForest.com and take your market analysis to the next level.
3 Downloads
Published:
Nov 02, 2025 13:02 PM
Category: