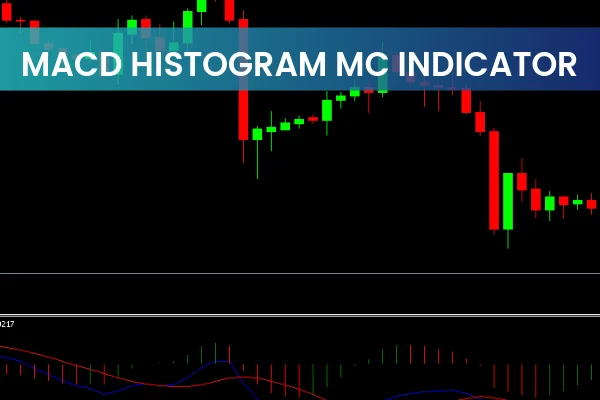
The MACD Histogram MC Indicator for MT5 is a powerful trading tool that displays the MACD lines of both the current chart timeframe and the next higher one—all in a single indicator window. This innovative setup allows forex traders to easily identify trend direction and make informed buy or sell decisions at a glance.

Unlike the standard MACD indicator, this version provides multi-timeframe analysis, giving traders a broader perspective of market momentum. While it works efficiently on all chart timeframes, higher timeframes generally yield more reliable signals and consistent trading results.
How the MACD Histogram MC Indicator for MT5 Works
The MACD Histogram MC indicator plots two main components:
Histogram bars representing the MACD of the current chart timeframe.
MACD and Signal lines of the next higher timeframe.
By overlaying these two timeframes, traders can assess both short-term and long-term momentum simultaneously. This helps reduce false signals and improves entry timing in trend-following or momentum-based strategies.
MACD Histogram MC Indicator Trade Setup
Using the Zero-Line Cross
One of the most common strategies involves observing the zero-line crossing of the histogram bars.
When the bars cross above zero, it signals a bullish trend.
When they fall below zero, it suggests a bearish trend.
However, for higher accuracy, traders confirm the move by checking if the higher timeframe MACD aligns with the same direction.
MACD Line and Signal Line Intersection
Aggressive traders often base entries on the intersection of the MACD line and signal line.
A bullish crossover (MACD crossing above the signal line) suggests upward momentum.
A bearish crossover (MACD crossing below the signal line) suggests downward momentum.
For additional confirmation, traders should ensure that the higher timeframe MACD supports the trade direction before entering a position.
Multi-Timeframe Line Intersection Strategy
Another advanced trading method involves the crossing of the lower and higher timeframe MACD lines:
When the lower timeframe MACD (red line) crosses above the higher timeframe MACD (blue line), it signals a potential bullish reversal.
When the red line crosses below the blue line, it indicates a bearish trend continuation.
This approach allows traders to synchronize their entries with broader market momentum, increasing the probability of success.
Benefits of Using the MACD Histogram MC Indicator for MT5
Comprehensive trend view: Combines short- and long-term momentum.
Reduced noise: Filters out false signals that often appear in lower timeframes.
Versatility: Works effectively on all currency pairs and timeframes.
Automation-ready: Suitable for use in Expert Advisors (EAs) and automated trading systems.
Conclusion
In summary, the MACD Histogram MC Indicator for MT5 is an invaluable tool for traders seeking to align multiple timeframe analyses in one chart. Whether you trade manually or through automation, this indicator simplifies trend detection and confirmation, allowing for smarter and more confident decision-making.
Visit IndicatorForest.com today to download the MACD Histogram MC Indicator for MT5 and explore more powerful forex indicators that enhance your trading performance.
1 Download
Published:
Nov 02, 2025 08:56 AM
Category: