Precision Trend Geometry with the Fractals 5 Diapazon Indicator for MT4
In the intricate world of technical analysis, Price Action often appears chaotic. However, market geometry reveals that price moves in repetitive, self-similar patterns known as fractals. While the standard Bill Williams Fractal is a staple for many, it often lacks the structural depth required for professional-grade trend analysis. The Fractals 5 Diapazon Indicator for MetaTrader 4 (MT4) is a revolutionary advancement in geometric charting, designed to identify multi-layered Support And Resistance zones by analyzing price across five distinct "diapazons" or ranges.
The Evolution of Fractal Analysis
Traditional fractals identify simple turning points—a high surrounded by two lower highs or a low surrounded by two higher lows. The Fractals 5 Diapazon Indicator evolves this concept by connecting these points through an automated trend-line algorithm. This creates a visual "web" or range (diapazon) that highlights the true structural boundaries of the market.
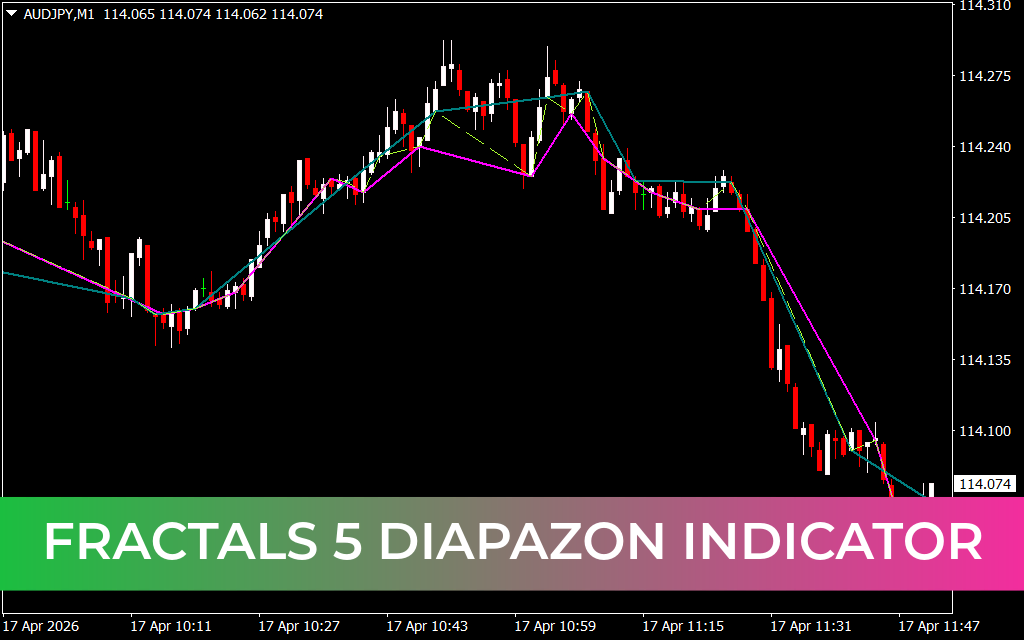
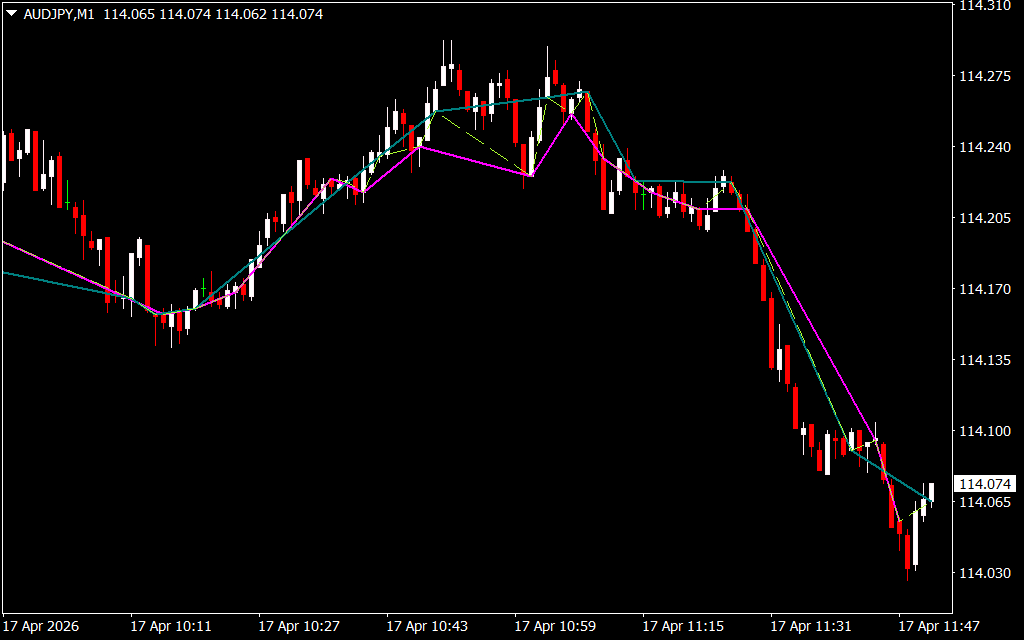
As demonstrated in technical analysis across major pairs like AUD/JPY on the M1 and M5 timeframes, the Fractals 5 Diapazon provides an unparalleled visual roadmap:
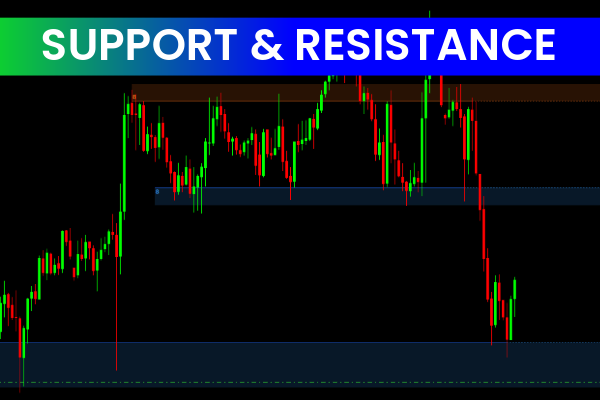
- Multi-Layered Structural Lines: The indicator projects several colored lines (typically teal, magenta, and yellow) across the chart. These represent the different diapazons of price action, allowing traders to see both the immediate micro-trend and the broader macro-structure simultaneously.
- Dynamic Range Identification: Unlike static horizontal lines, these diapazon lines adapt to the slope of the trend. As seen on the AUD/JPY M1 chart, the lines act as a "channel of truth," narrowing during consolidation and expanding during high-velocity breakouts.
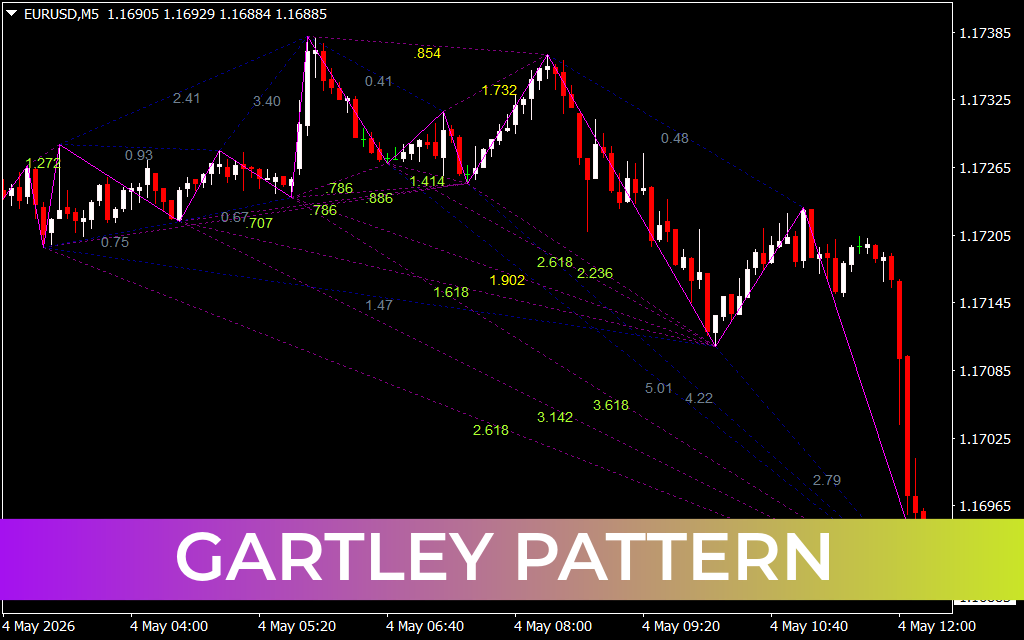
- Automated Swing Point Connectivity: The indicator removes the subjectivity of manual trend-line drawing. By automatically connecting the most significant fractal peaks and troughs, it ensures that your support and resistance levels are mathematically objective.
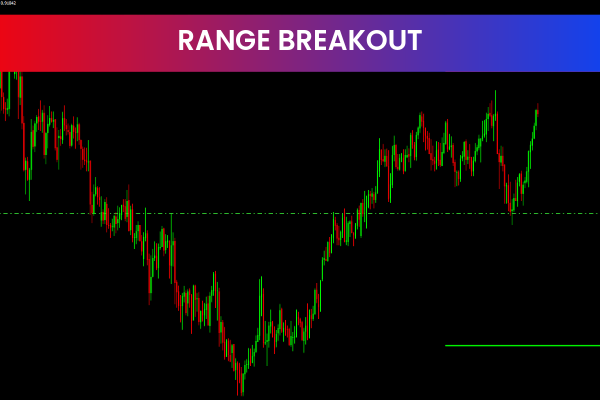
- Breakout Confirmation Zones: When price pierces through a cluster of diapazon lines, it signals a high-probability breakout. The indicator effectively filters out "fake-outs" by requiring price to breach a specific structural range rather than just a single price point.
Strategic Advantages for Geometric Traders
The Fractals 5 Diapazon Indicator is an essential asset for traders who value market geometry and structural integrity over lagging oscillators.
- Crystal Clear Market Structure: By visualizing the market as a series of connected ranges, the indicator makes it easy to identify if a market is trending, ranging, or transitioning into a reversal.
- Surgical Stop-Loss Placement: Use the outer diapazon lines as objective "safety zones" for stop-loss placement. In an uptrend, placing a stop below the lowest active diapazon line significantly reduces the risk of being stopped out by minor market noise.
- High-Confluence Entry Points: The most powerful signals occur when multiple diapazon lines converge at a single price level. This "clustering" indicates a major structural barrier that, once broken, often leads to explosive moves.
- Universal Application: Whether you are a high-frequency scalper seeking micro-ranges on the M1 or a swing trader tracking long-term diapazons on the H4, the algorithm scales its sensitivity to match the "DNA" of any asset.
Conclusion
The Fractals 5 Diapazon Indicator for MT4 is a definitive tool for any trader seeking to master the geometry of the financial markets. By bridging the gap between simple fractal points and complex structural ranges, it empowers you to navigate price action with professional-grade clarity and confidence. Elevate your MT4 terminal today and experience the precision of the Fractals 5 Diapazon.
7 Downloads
Last Update:
Apr 17, 2026 14:53 PM
Published:
Feb 09, 2026 12:55 PM
Category: