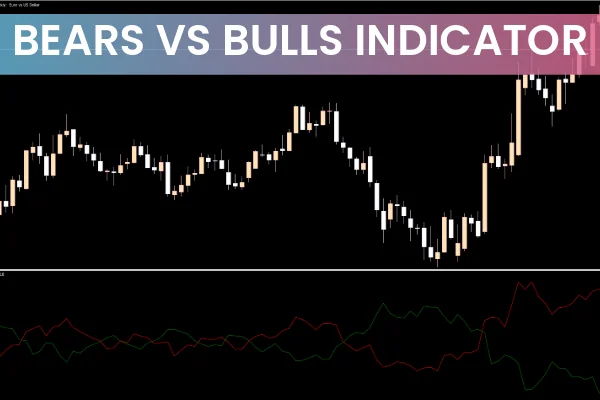
The Bears vs Bulls Indicator is a MetaTrader 5 tool designed to reveal the strength of bullish and bearish Price Action in the forex market. In trading terms, bulls represent buyers, while bears represent sellers. The indicator analyzes this ongoing battle between buyers and sellers, following the logic behind the well-known Elder-Ray Index. By visualizing buyer and seller dominance with simple colored lines, the Bears vs Bulls Indicator helps traders identify potential market direction and high-quality trading setups.
This indicator is suitable for beginners, intermediate traders, and advanced forex traders. It also works effectively with other technical tools, including exponential moving averages (EMA), Bollinger Bands, trend indicators, and oscillators.
How the Bears vs Bulls Indicator Works
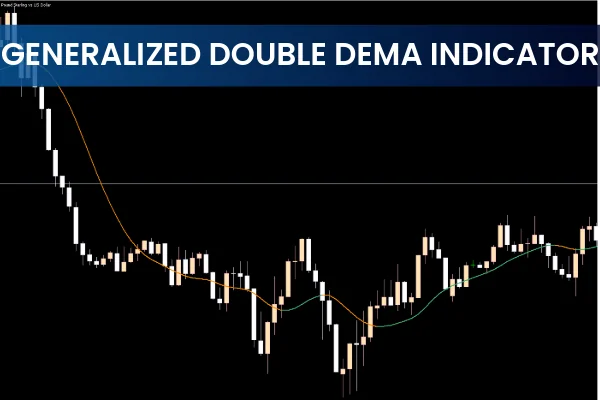
The Bears vs Bulls Indicator plots two main lines on the chart:
Red Line: Represents bulls (buyers)
Green Line: Represents bears (sellers)
These dynamic lines rise and fall with market pressure, helping traders see which group currently controls the price movement.
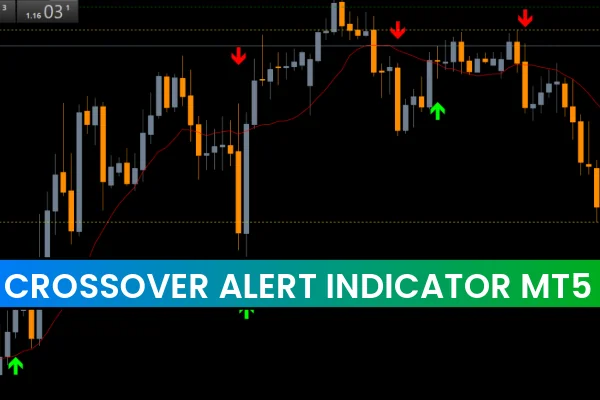
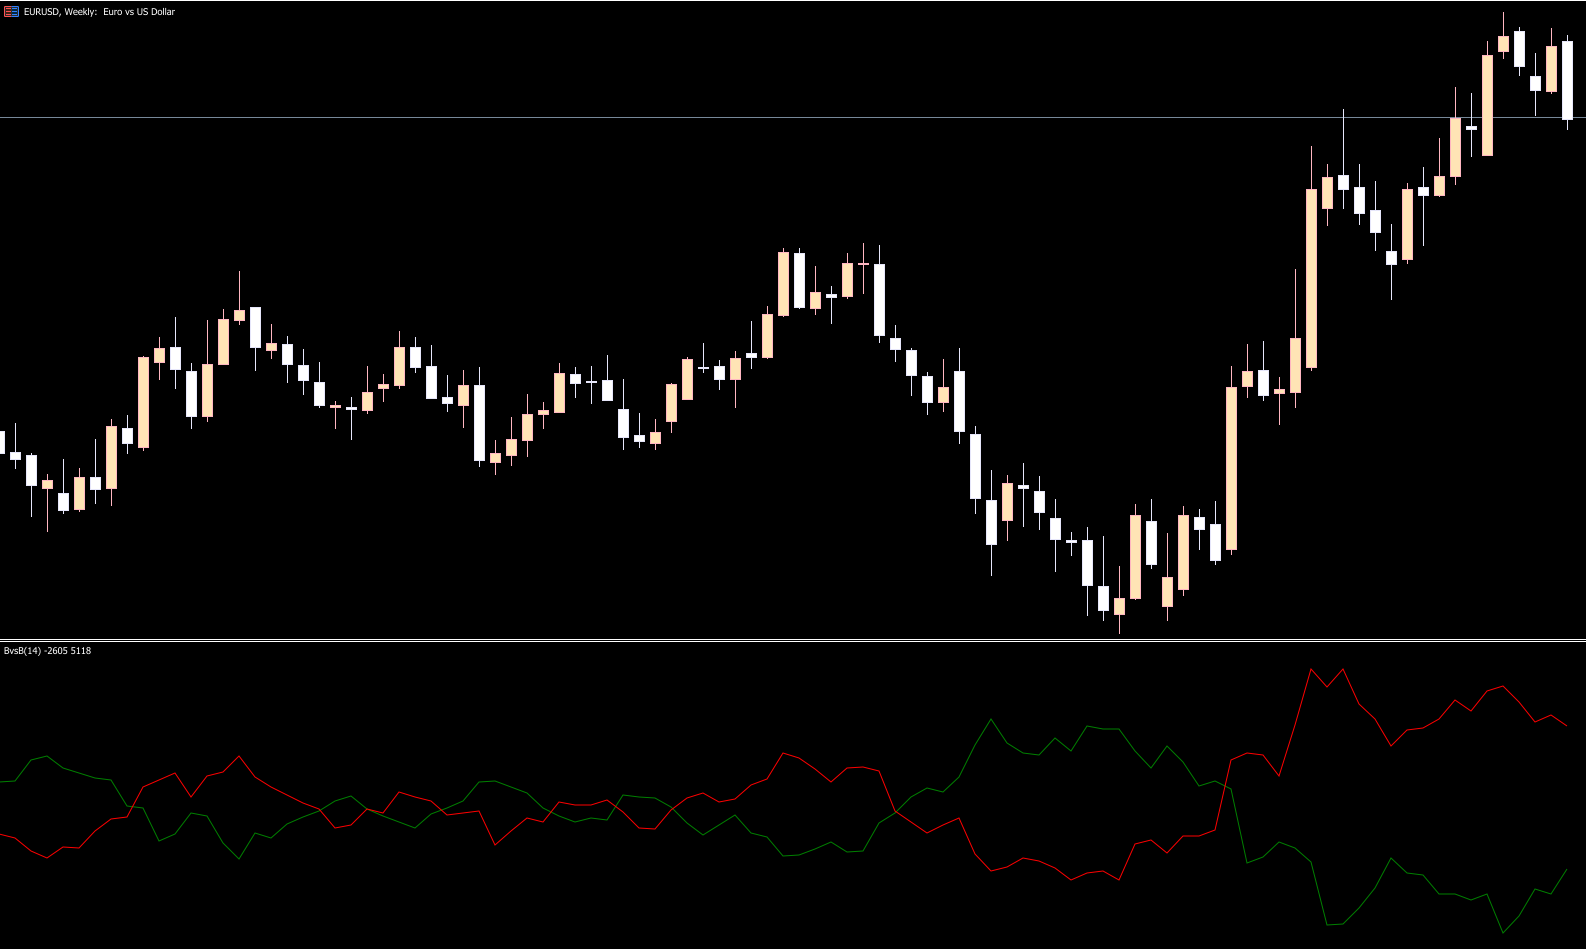
BUY/SELL Signals Using the Bears vs Bulls Indicator
To generate trading decisions, traders simply interpret the relationship between the two lines.
BUY Signals
A BUY signal occurs when the red line rises above the green line.
This indicates growing bullish pressure, meaning buyers are taking control of the market.
SELL Signals
A SELL signal appears when the green line climbs above the red line.
This shift shows that sellers are dominating and bearish momentum is increasing.
Because the indicator clearly reflects the strength of buyers and sellers, it is ideal for highlighting the most favorable trading opportunities—especially in trending markets.
Applying the Indicator in Real Trading
Traders often combine this tool with other indicators to confirm the overall market direction. For example:
EMAs help confirm whether the market is trending.
Bollinger Bands can identify volatility expansions or compression.
Price action patterns can validate the indicator’s signals.
On an EUR/USD M30 chart, the indicator provides clean visual cues of strength shifts. When the red line surpasses the green one, buy setups are favored. When the green line overtakes the red one, sell opportunities become more reliable.
Why Traders Use the Bears vs Bulls Indicator
Helps identify buyer vs seller dominance
Provides clear BUY/SELL crossover signals
Simple visual interpretation for all skill levels
Works well with trend-following strategies
Useful across multiple timeframes and forex pairs
Free and easy to install on MT5
Conclusion
The Bears vs Bulls Indicator for MT5 offers a simple yet effective way to locate BUY and SELL signals based on the strength of buyers (bulls) and sellers (bears). With its clear red and green line signals, it helps traders find high-probability setups and understand market momentum. To download this indicator and explore more forex tools, visit IndicatorForest.com.
FAQ
5 Downloads
Published:
Nov 15, 2025 13:34 PM
Category: