Master Market Geometry with the Fibonacci Progression With Breaks Indicator
In the realm of technical analysis, few concepts are as enduring or powerful as the Fibonacci sequence. Professional traders use these mathematical ratios to identify hidden levels of Support And Resistance that the "naked eye" often misses. The Fibonacci Progression With Breaks Indicator for MetaTrader is an advanced algorithmic tool designed to automate this complex process. By dynamically plotting progression levels and identifying critical structural "breaks," this indicator transforms raw Price Action into a precise, actionable roadmap for any financial asset.
The Science of Fibonacci and Market Structure
Traditional Fibonacci retracements are often static and require manual placement, leading to subjective bias. The Fibonacci Progression With Breaks Indicator removes this human error by automatically calculating levels based on recent market swings. It doesn't just show where price might stall; it identifies where the market has officially shifted its momentum.
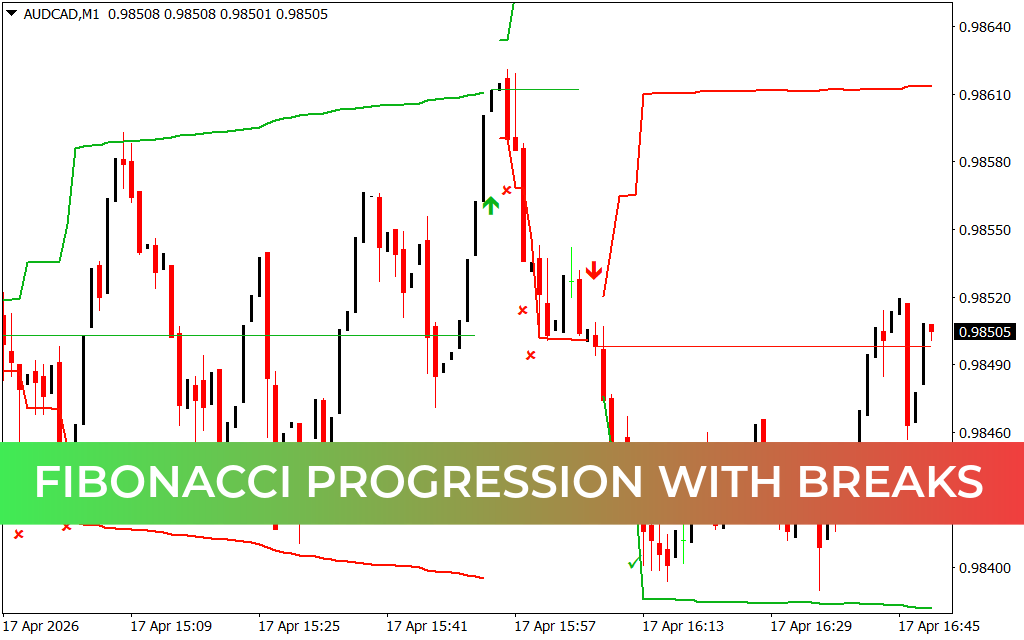
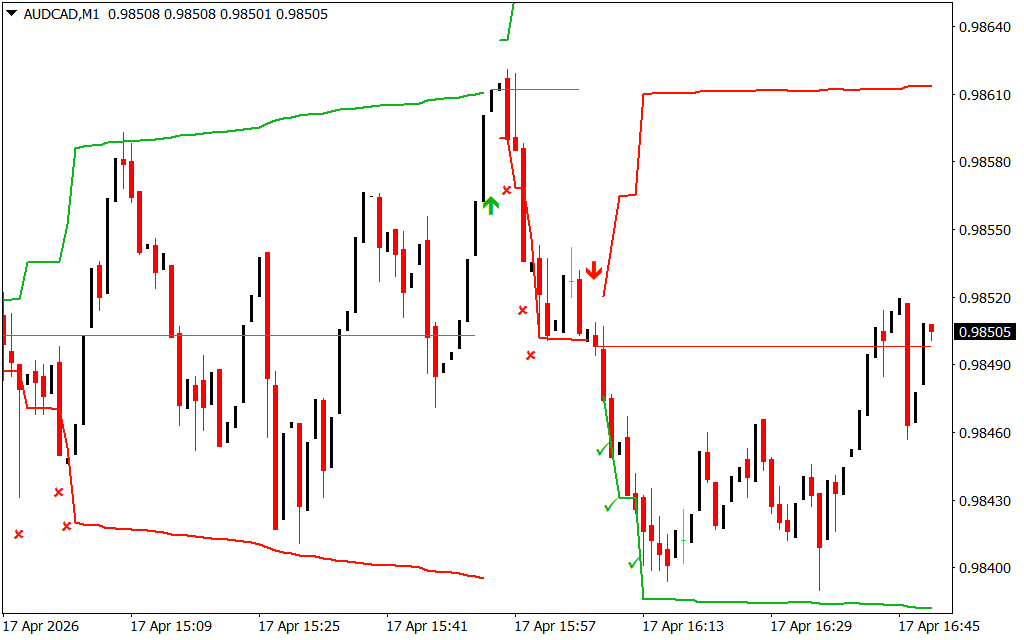
As demonstrated in technical analysis across major pairs like AUD/CAD on the M1 timeframe, the indicator provides a multi-layered analytical edge:
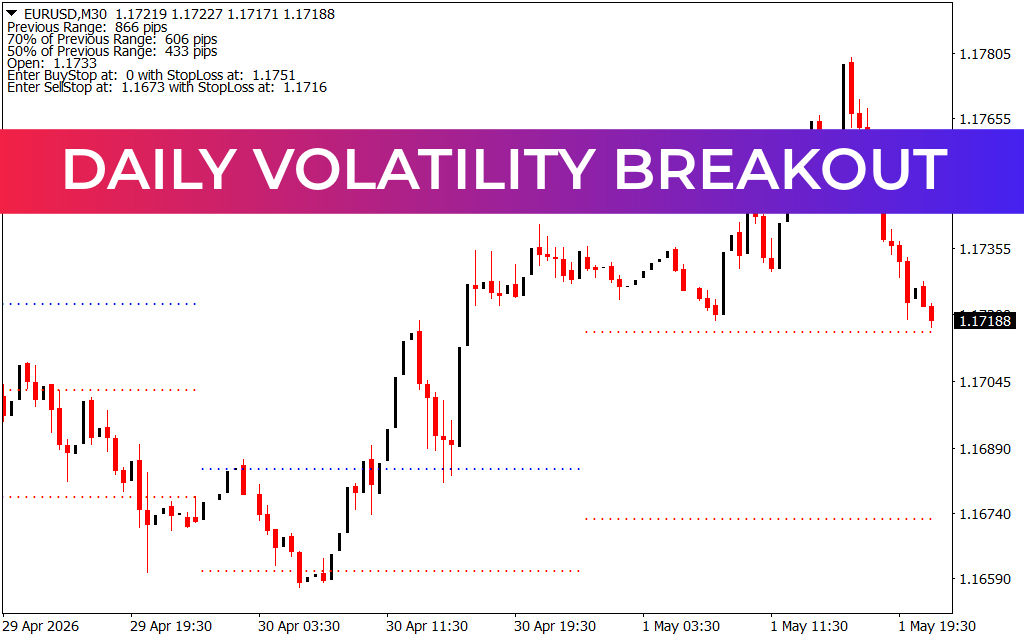
- Dynamic Progression Channels: The indicator plots upper and lower boundaries based on Fibonacci expansion ratios. These lines act as "volatility bands" that expand and contract based on market intensity, providing a clear visual of the current trading range.
- Automated Breakout Detection: The most powerful feature of this tool is its ability to identify "breaks." When price convincingly closes outside of a Fibonacci level, the indicator signals a structural shift. As seen on short-term charts, these breaks often precede significant momentum expansions.
- Trend Reversal Cues: The indicator utilizes color-coded arrows and lines (typically green for bullish and red for bearish) to highlight where a progression has been broken. This allows traders to identify the exact moment a trend loses its mathematical integrity.
- Surgical Entry and Exit Points: By using the Fibonacci levels as dynamic support and resistance, traders can place orders at "high-conviction" zones. Entering a trade on a retest of a broken Fibonacci level offers an institutional-grade risk-to-reward ratio.
Strategic Advantages for Systematic Traders
Integrating the Fibonacci Progression With Breaks Indicator into your workflow moves your strategy beyond retail-level guessing and into the realm of quantitative market geometry.
- Objective Level Identification: Eliminate the frustration of drawing Fibonacci lines manually. The indicator ensures your levels are mathematically perfect every time the chart updates.
- Visual Clarity in Chaos: On lower timeframes like the M1 or M5, price action can appear noisy. This indicator filters that noise by focusing only on levels that meet the Fibonacci criteria.
- Enhanced Confluence: This tool serves as a perfect companion to other indicators. For example, when a price "break" occurs simultaneously with a momentum shift, the probability of a successful trade increases exponentially.
- Adaptability Across Assets: Whether you are trading Forex majors, Indices, or Gold, the Fibonacci sequence remains a universal law of market movement, making this indicator a versatile asset for any portfolio.
Conclusion
The Fibonacci Progression With Breaks Indicator is a definitive solution for traders who demand precision and automation. By bridging the gap between ancient mathematical ratios and modern algorithmic trading, it empowers you to navigate the markets with professional-grade confidence. Elevate your terminal today and start trading with the geometric precision of the Fibonacci Progression system.
10 Downloads
Last Update:
Apr 17, 2026 19:51 PM
Published:
Feb 09, 2026 12:18 PM
Category: