Capitalize on Market Momentum with the Daily Volatility Breakout Indicator
In the Forex market, volatility is not an enemy—it is the fuel for every profitable trend. Professional traders know that the most significant price moves often occur following periods of market consolidation, when energy builds up before a decisive breakout. The Daily Volatility Breakout indicator is designed to mathematically pinpoint these opportunities, providing traders with clear, actionable levels to enter the market exactly when momentum shifts.
Understanding the Mechanics of Volatility
Markets rarely move in a straight line. They oscillate between phases of "range-bound" movement—where buyers and sellers are in equilibrium—and "breakout" phases, where one side overwhelms the other. The Daily Volatility Breakout Indicator analyzes the previous day's price range to forecast potential breakout zones for the current session.
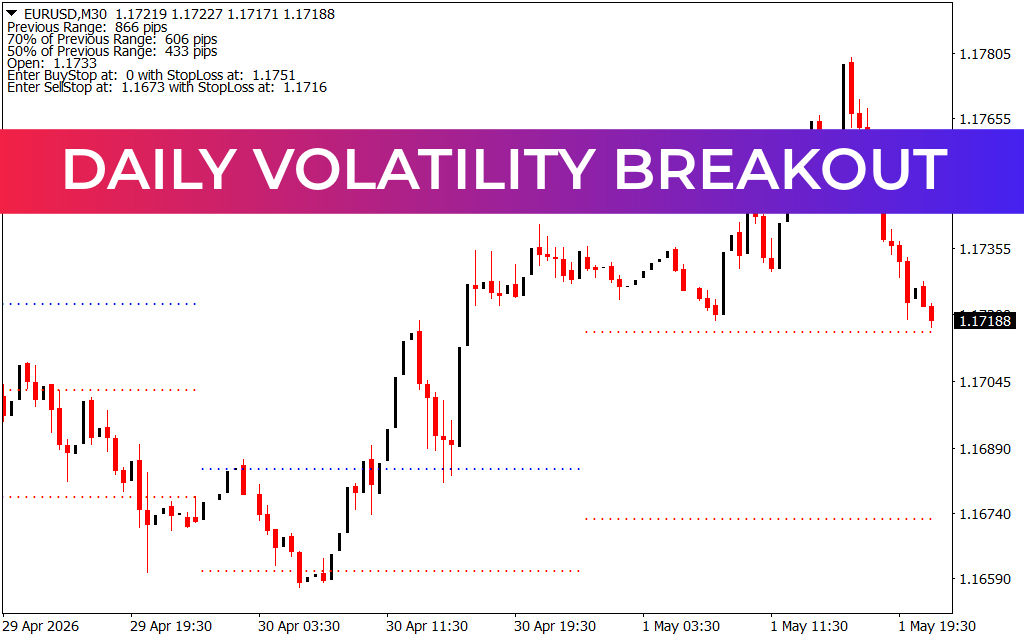
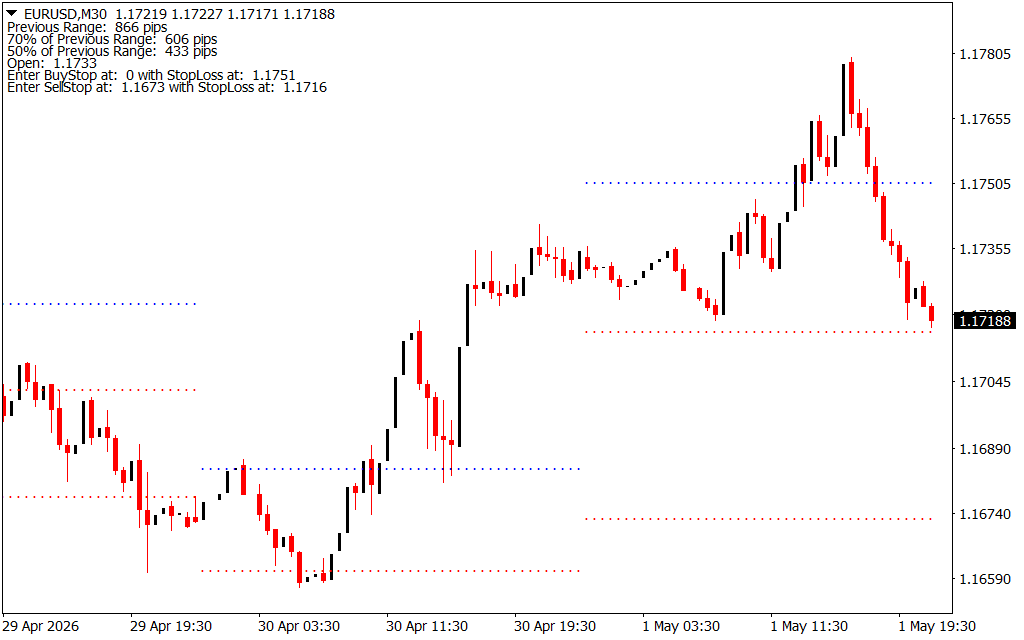
As illustrated on your EUR/USD M30 chart, the indicator automatically calculates key statistical milestones:
- Previous Range: The total movement from the previous period.
- 50% and 70% Levels: Critical thresholds that represent the "sweet spot" for breakout momentum.
By providing these levels as horizontal reference lines (as seen in the chart), the indicator transforms raw volatility data into a strategic roadmap.
Why This Tool is Essential for Scalpers and Swing Traders
Traders often struggle to identify the "trigger" point for a trade. If you enter too early, you risk being caught in a false breakout (a "fake-out"). If you enter too late, you miss the meat of the move. The Daily Volatility Breakout solves this by offering a disciplined approach:
- Automated Levels: You no longer need to manually calculate ranges or plot support and resistance levels. The indicator does the heavy lifting, providing specific price points for BuyStop and SellStop orders.
- Risk-Defined Trading: Because the indicator provides stop-loss suggestions alongside entry points, it encourages a risk-first mindset. You always know exactly where you are wrong before you even open the trade.
- Removal of Emotional Bias: By relying on mathematical volatility calculations rather than gut feeling, you remain consistent. You wait for the market to prove its direction by breaching the defined range, rather than guessing where it will turn.
Strategic Implementation for Success
To get the most out of this tool, consider these professional tips:
- Session Timing: The most powerful breakouts often coincide with the London or New York market openings. Use the indicator's levels to set pending orders just before these liquidity injections.
- Trend Alignment: If the Daily Volatility Breakout suggests a buy, but the overall trend (on a higher timeframe like H4) is strongly bearish, exercise caution. High-probability trades occur when the volatility breakout aligns with the primary market trend.
- Stop Management: As the trade moves in your favor, use the indicator's levels to trail your stop-loss, protecting your capital while allowing the breakout to reach its full potential.
The Daily Volatility Breakout is more than a signal tool; it is a systematic framework that ensures you are always ready to capture the market's most profitable moves.
4 Downloads
Last Update:
May 02, 2026 13:46 PM
Published:
Jan 29, 2026 17:49 PM
Category: