Master Key Price Levels with the MTF Resistance Support Indicator
In the world of technical analysis, few concepts are as foundational as Support And Resistance. These levels represent the psychological "floor" and "ceiling" where price action historicaly struggles to break through. However, a major trap for retail traders is focusing solely on the current timeframe. The MTF Resistance Support (Multi-Timeframe) indicator solves this by projecting critical levels from higher timeframes directly onto your active chart.
What is MTF Resistance Support?
The MTF Resistance Support indicator is an advanced charting tool that automatically identifies and draws horizontal levels based on various timeframes. Instead of manually flipping between the 1-hour, 4-hour, and Daily charts, this indicator plots them simultaneously using a series of color-coded dots.
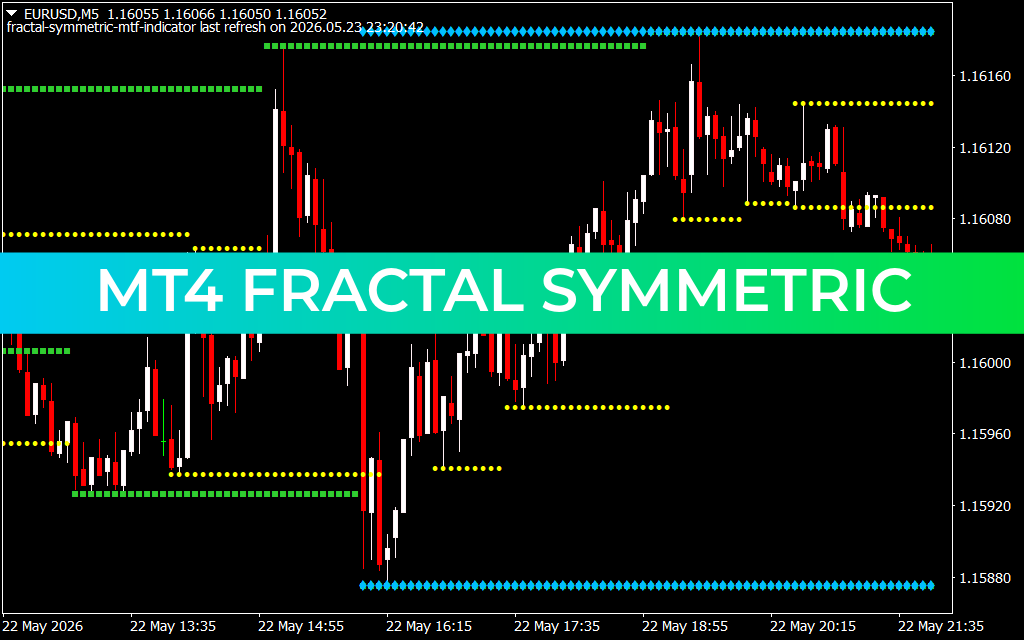
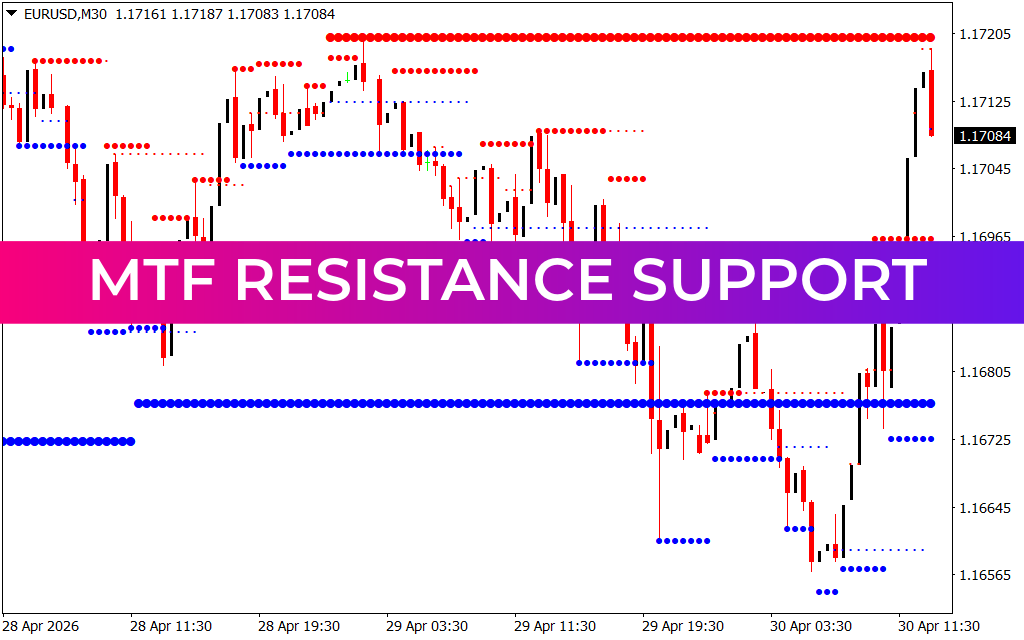
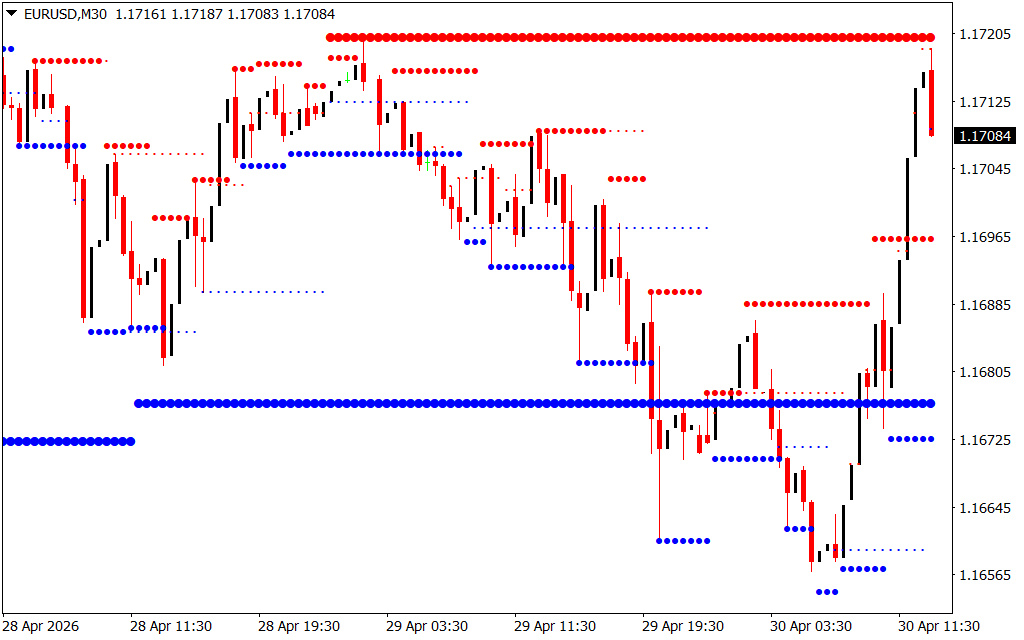
As shown in the EURUSDM30.png example, the indicator populates the chart with red dots (Resistance) and blue dots (Support). By seeing where a 30-minute support level aligns with a 4-hour support level, you can identify high-confluence zones where the market is most likely to react.
Why Multi-Timeframe Analysis Matters
- Institutional Perspective: Banks and hedge funds rarely trade based on 5-minute charts. They look at weekly and daily levels. By using an MTF indicator, you align your strategy with the "smart money."
- Confluence Detection: The most powerful trade setups occur when levels from different timeframes overlap. This indicator makes these "clusters" visually obvious.
- Reduced Market Noise: Minor support levels on a 1-minute chart often fail. By keeping higher-timeframe resistance levels in view, you avoid "buying into a ceiling."
- Dynamic Updating: As new price data comes in, the indicator updates the dots in real-time, ensuring your support and resistance zones are always mathematically accurate.
Trading Strategies with MTF Support and Resistance
The most effective way to utilize this indicator is the Break-and-Retest strategy.
- Identify a Major Level: Look for a thick line of dots that has held price back multiple times.
- Wait for the Breakout: Monitor Price Action as it aggressively moves through a red resistance or blue support zone.
- Confirm the Retest: Once the level is broken, it often flips its role (Resistance becomes Support). Wait for the price to return to the dots and show signs of rejection—such as a long-wick candle—before entering.
In the provided chart, you can see how price often bounces between these dotted "tracks." When the price reaches a major blue support zone at the bottom, it provides a low-risk entry point for a bullish reversal.
Conclusion
The MTF Resistance Support indicator is a mandatory tool for any trader serious about price action. It bridges the gap between different timeframes, providing a 360-degree view of market structure. By automating the identification of these psychological barriers, you can focus on what truly matters: executing disciplined, high-probability trades.
6 Downloads
Last Update:
Apr 30, 2026 16:54 PM
Published:
Jan 30, 2026 19:01 PM
Category: