The OBV Indicator for MT5 (On Balance Volume) is a powerful technical analysis tool that measures buying and selling pressure based on trading volume. It works on the principle that volume leads price, meaning that changes in volume often precede price movements. By tracking cumulative volume flow, the indicator helps traders identify market trends, potential reversals, and periods of indecision.
When the OBV line rises, it indicates that volume on up days exceeds that on down days — signaling a bullish trend. Conversely, when the OBV line falls, it means selling pressure is dominating, suggesting a bearish market. If the OBV moves sideways, the market is in a neutral or ranging phase.
How the OBV Indicator Works
The OBV indicator for MetaTrader 5 calculates cumulative buying and selling pressure using the relationship between price and volume. It adds the current period’s volume when the price closes higher than the previous close and subtracts it when the price closes lower.
This calculation helps reveal whether traders are accumulating (buying) or distributing (selling) an asset. The logic is straightforward:
Rising OBV Line: Buyers dominate, and prices are likely to move up.
Falling OBV Line: Sellers dominate, and prices may drop further.
Flat OBV Line: Market indecision or consolidation.
Because OBV reflects the flow of money into or out of an asset, it often signals potential reversals before the actual price move occurs.
How to Trade Using OBV Indicator for MT5
The OBV Indicator is a versatile tool suitable for both beginners and experienced traders. It can be used to spot new trends, confirm existing ones, or anticipate reversals.
Below are several proven methods to trade using OBV on the MetaTrader 5 platform:
Trend Following Strategy
In a trending market:
Buy Signal: When OBV rises along with price, confirming an uptrend.
Sell Signal: When OBV falls while price declines, confirming a downtrend.
If price rises but OBV remains flat, it’s a warning that the rally lacks volume support and may not be sustainable.
Divergence Trading
A divergence occurs when the OBV and price move in opposite directions.
Bullish Divergence: Price makes lower lows, but OBV forms higher lows — signaling potential trend reversal upward.
Bearish Divergence: Price makes higher highs, but OBV forms lower highs — indicating weakening momentum and possible downward reversal.
This setup often provides early entry signals before the trend shifts.
Trendline Breakout Strategy
Another effective way to use the OBV Indicator for MT5 is by drawing trendlines on both the price chart and the OBV line.
When both lines break their respective trendlines simultaneously, it suggests a strong breakout and confirms a change in trend direction.
Buy Entry: When both price and OBV break above resistance trendlines.
Sell Entry: When both break below support trendlines.
In this setup, the OBV acts as a volume confirmation tool, validating the strength of the breakout.
Multi-Timeframe (MTF) Strategy
Professional traders often use the OBV indicator in a multi-timeframe setup.
On higher timeframes (H4 or Daily), use OBV to determine the overall market trend.
On lower timeframes (M15 or H1), look for entry opportunities aligned with that major trend.
This combination helps identify high-probability setups with minimal noise.
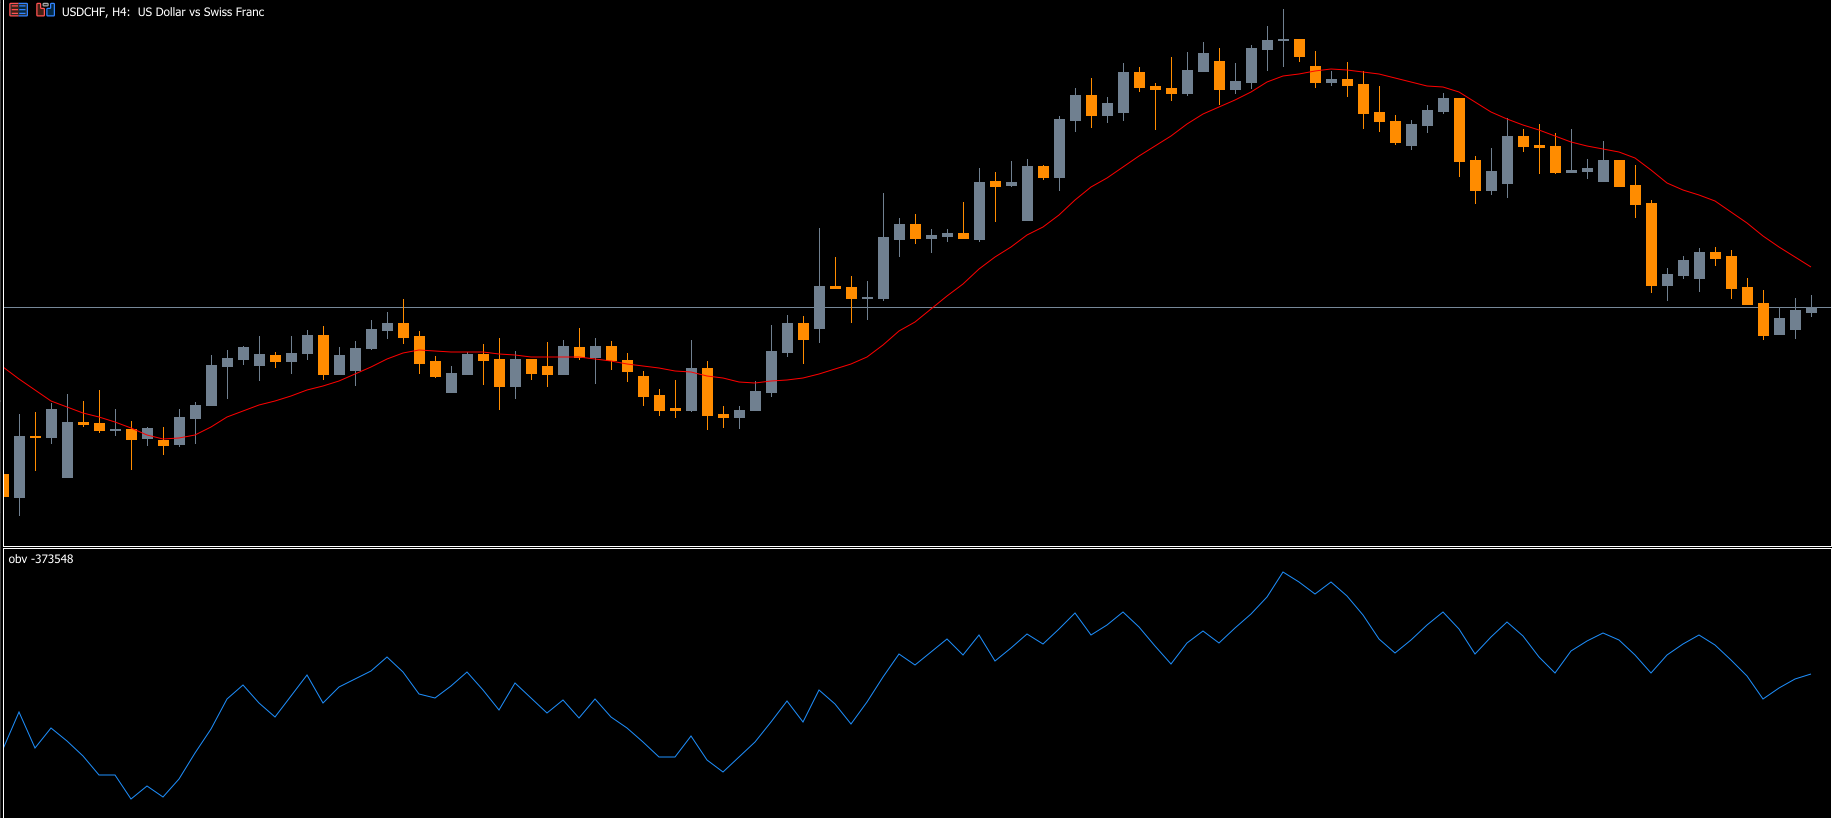
Example: OBV Indicator in Action
On the GBPUSD H1 chart, the OBV indicator appears as a blue line in a separate window below the price chart.
When the OBV line trends upward, traders can open buy positions.
Take Profit: When OBV begins to flatten or reverse downward.
Stop Loss: Below the previous swing low.
When the OBV line trends downward, traders can enter sell positions.
Take Profit: When OBV reverses upward.
Stop Loss: Above the previous swing high.
This simple yet effective approach allows traders to align their trades with real market momentum.
Advantages of the OBV Indicator for MT5
Simple and easy to interpret for both beginners and professionals.
Identifies Trend Strength, reversals, and volume confirmation.
Works across all timeframes and financial instruments.
Supports various strategies like trendline, divergence, and MTF trading.
Free to download and install on MetaTrader 5.
Conclusion
The OBV Indicator for MT5 is a valuable tool that bridges the gap between price movement and trading volume. By analyzing how volume flows with price, traders gain deeper insights into the strength and sustainability of a trend. It effectively highlights bullish, bearish, or neutral market conditions, helping traders avoid choppy markets and make data-driven decisions.
Whether you’re a beginner looking to understand price-volume dynamics or an advanced trader seeking volume confirmation for complex strategies, the OBV Indicator is a must-have in your MT5 toolbox.
👉 [Internal link placeholder: Explore More Volume Indicators for MT5]
👉 [Internal link placeholder: Download Other MT5 Trend Indicators]
FAQ
2 Downloads
Published:
Nov 12, 2025 23:12 PM
Category: