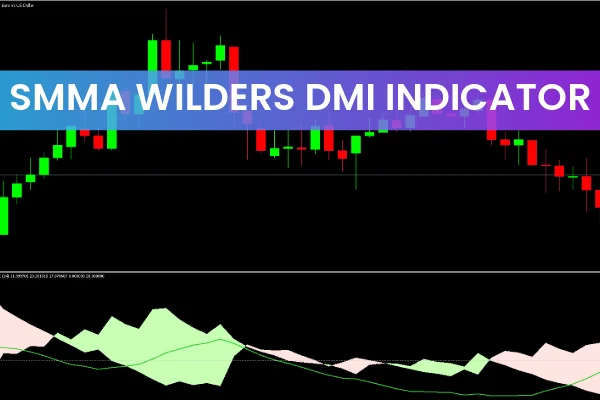
The SMMA Wilders DMI Indicator for MT5 is a powerful and reliable trend strength indicator that helps traders determine both the direction and momentum of price movements. Built upon the Directional Movement Index (DMI) system and Wilder’s smoothing method, this indicator displays the relationship between +DI (Positive Directional Indicator) and –DI (Negative Directional Indicator) lines, along with ADX and ADXR signals for deeper insight into market trends.
By combining these elements, the SMMA Wilders DMI Indicator allows traders to identify when the market is trending strongly or when it’s likely to change direction — making it suitable for both novice and experienced traders.
How the SMMA Wilders DMI Indicator Works
The SMMA Wilders DMI Indicator operates by analyzing directional price movements and smoothing them using a Smoothed Moving Average (SMMA) formula. This creates smoother, more reliable signals that reduce market noise.
The indicator displays:
+DI Line (Positive Direction): Indicates upward momentum and buying pressure.
–DI Line (Negative Direction): Reflects downward momentum and selling pressure.
ADX (Average Directional Index): Measures the strength of the trend, regardless of direction.
ADXR (Average Directional Movement Rating): A smoothed version of ADX that confirms long-term stability.
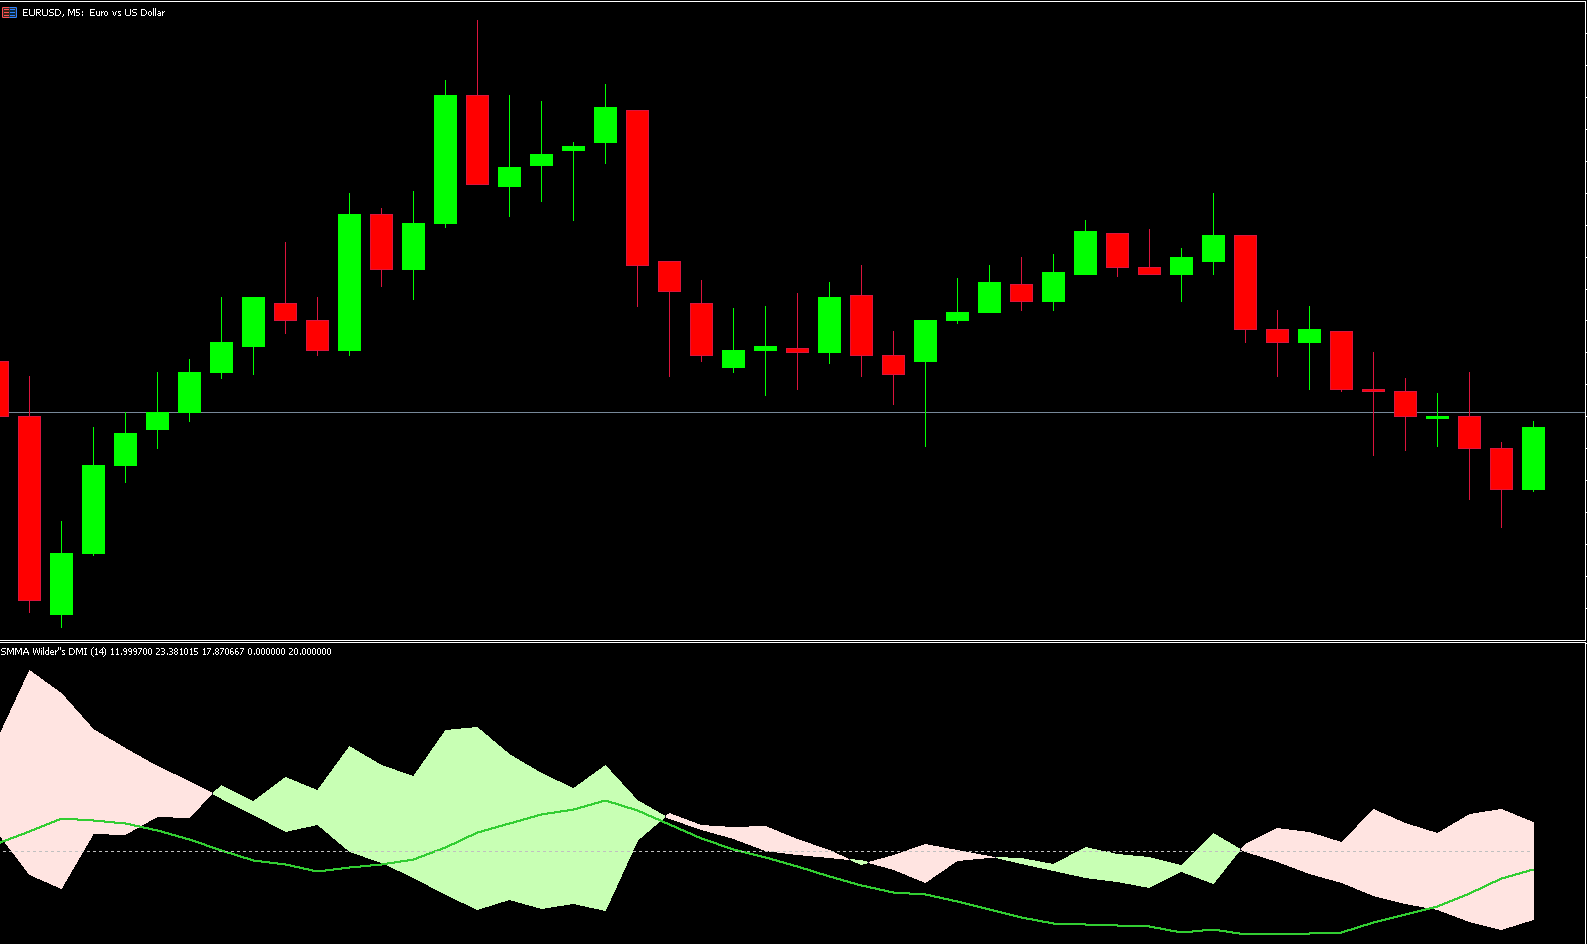
Colored Zone: Highlights the area between +DI and –DI, showing whether buyers (green) or sellers (pink) dominate.
When +DI crosses above –DI, the market is turning bullish. Conversely, when –DI crosses above +DI, the market is turning bearish.
SMMA Wilders DMI BUY and SELL Signals
A buy opportunity occurs when the zone turns light green, indicating that bullish momentum is building.
The ADX line rises above the 20 level, confirming that the market is entering a strong uptrend.
An expanding green zone suggests that buying pressure is increasing.
You can optionally confirm the trade by checking the ADXR line, which should support the uptrend signal.
Exit Signal
When the +DI and –DI lines cross, it signals a trend reversal or weakening of the current move.
This is a good time to close existing trades or prepare for an opposite trade direction.
Real Market Example
Let’s look at an example on the EUR/USD H1 chart. After the +DI and –DI lines intersected, a pink zone appeared, indicating a shift into bearish momentum. The ADX line climbed above the 20 level, confirming strong downward pressure.
From this point, the currency pair continued to move lower, validating the sell signal. The trader would ideally close the trade once the zone begins turning green, signaling the start of a potential bullish reversal.
Why Use the SMMA Wilders DMI Indicator for MT5
The SMMA Wilders DMI Indicator for MT5 is one of the most practical and precise tools for trend analysis. Its ability to measure both direction and strength gives traders a clear advantage in any market condition.
Key benefits include:
Clear visualization of Trend Strength and direction.
Reduced market noise thanks to Wilder’s smoothing method.
Suitable for any timeframe and any asset class, including forex, commodities, and indices.
Effective for both beginners and advanced traders.
Free and easy to install on MetaTrader 5.
Whether you trade long-term or short-term, this indicator helps you enter strong trends early and exit before reversals, enhancing both profitability and confidence.
Conclusion
The SMMA Wilders DMI Indicator for MT5 is an advanced trading tool that combines DMI, ADX, and ADXR to provide a complete view of market trends. By monitoring the crossovers of +DI and –DI lines and watching for ADX levels above 20, traders can make informed decisions about when to buy, sell, or exit trades.
Download the SMMA Wilders DMI Indicator today from IndicatorForest.com and start using it to analyze trend strength, direction, and momentum like a pro.
FAQ
1 Download
Published:
Nov 10, 2025 01:16 AM
Category: