The Chart Angles V3 Indicator is a powerful MT4 trend indicator designed to track price correction cycles and highlight potential trend reversals. It works seamlessly on multi-timeframe (MTF) charts, allowing traders to analyze both short- and long-term market structures. Whether you trade forex, indices, or stocks, the Chart Angles V3 Indicator helps you identify market turning points with high accuracy.
This indicator is particularly useful for price-action traders who look for trend reversal opportunities as buy or sell setups. By visually representing the angle of price movement and showing step-MA (moving average) crossovers, it reveals when the market may be shifting momentum — a key insight for anyone looking to catch early trend changes.
The Chart Angles V3 Indicator uses step-MA crossovers to determine the dominant trend direction.
When the blue MA line crosses above the green zigzag line, and the indicator value turns positive, it signals a bullish trend.
Conversely, when the blue line falls below the green zigzag, and the indicator value becomes negative, it suggests a bearish trend.
These visual cues make it easy for traders to quickly assess whether the market is trending up or down without relying solely on candlestick analysis.
To improve your trading accuracy, it’s best to combine Chart Angles V3 signals with support and resistance levels, trendlines, or horizontal zones.
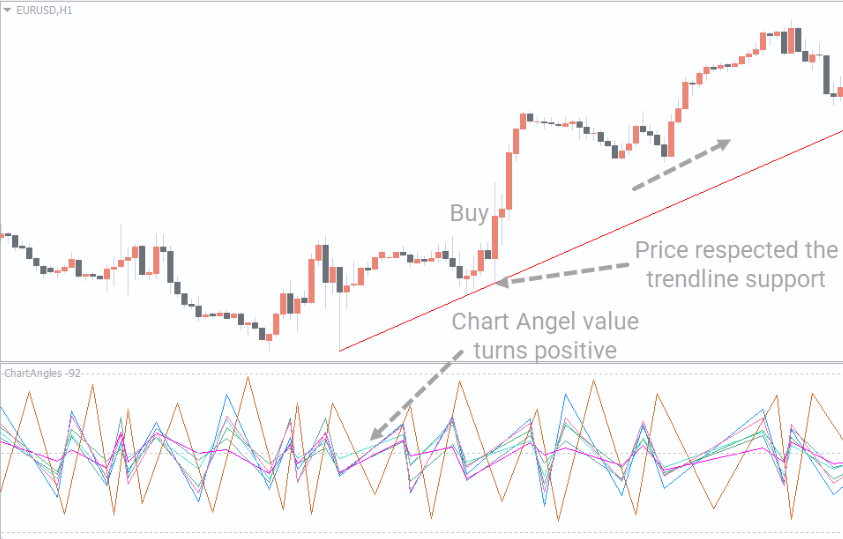
For instance, when the indicator shows a bullish crossover near a trendline support, it often confirms a potential buy entry. Similarly, a bearish signal forming near resistance can be an ideal sell setup.
Integrating these confirmations reduces false signals and helps you make more confident trading decisions.
Besides traditional tools like daily pivot points or Fibonacci retracements, you can pair Chart Angles V3 with dynamic indicators such as:
Simple Moving Averages (SMA)
Exponential Moving Averages (EMA)
Bollinger Bands
These tools help confirm market direction and strengthen your overall trend-trading strategy.
Imagine analyzing the EUR/USD chart where the price rejects a trendline support. The Chart Angles V3 Indicator then displays a positive chart angle value with the blue line crossing above the green zigzag. This combination suggests a strong trend-following buy signal — perfect for traders who prefer momentum-based entries.
Always confirm indicator signals with price action or volume analysis.
Test the indicator on higher timeframes (H4 or Daily) to avoid market noise.
Use stop-loss orders based on recent swing highs/lows for risk management.
Combine with other MT4 tools available at IndicatorForest.com for better confluence.
The Chart Angles V3 Indicator is a versatile MT4 tool that identifies trend direction and reversal zones with clarity. By aligning its signals with price patterns and moving averages, traders can improve both entry and exit timing.
If you’re serious about refining your trend-trading strategy, download and test the Chart Angles V3 Indicator from IndicatorForest.com today and experience a new level of market precision.
Published:
Oct 17, 2025 05:58 AM
Category: