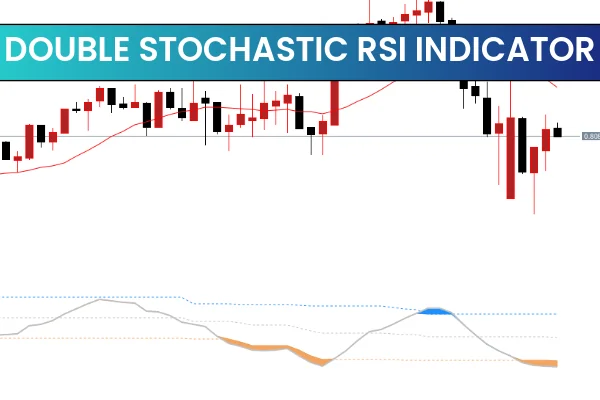
The Double Stochastic RSI Indicator MT5 brings together two of the most trusted technical oscillators—Stochastic and RSI—into one advanced, non-repainting momentum tool. Both indicators are known for identifying overbought and oversold zones, but each measures momentum differently. RSI is smoother and less reactive, while Stochastic is more sensitive to price fluctuations. Many traders often debate which is better, but with the Double Stochastic RSI indicator, you don’t have to choose; it allows you to use both simultaneously to generate more reliable reversal signals.
This indicator automatically analyzes price movements, highlighting strong momentum shifts, trend exhaustion, and potential reversal zones. Whether you trade forex, crypto, indices, or equities, the Double Stochastic RSI indicator is versatile and effective across all assets and timeframes on MT5.
Structure of the Double Stochastic RSI Indicator
The indicator is composed of:
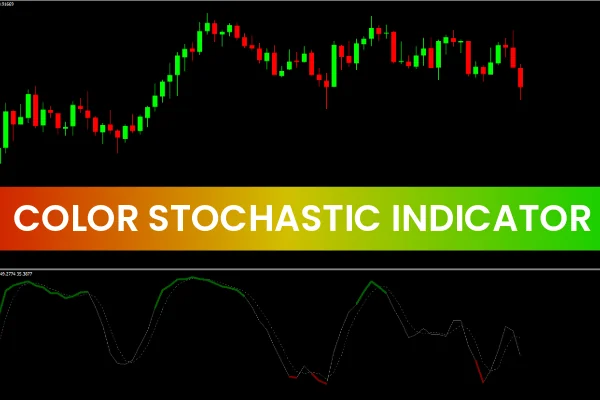
A main dynamic line – fluctuating between 0 and 100
Customizable overbought and oversold zones
Automatic color changes to highlight bullish or bearish pressure
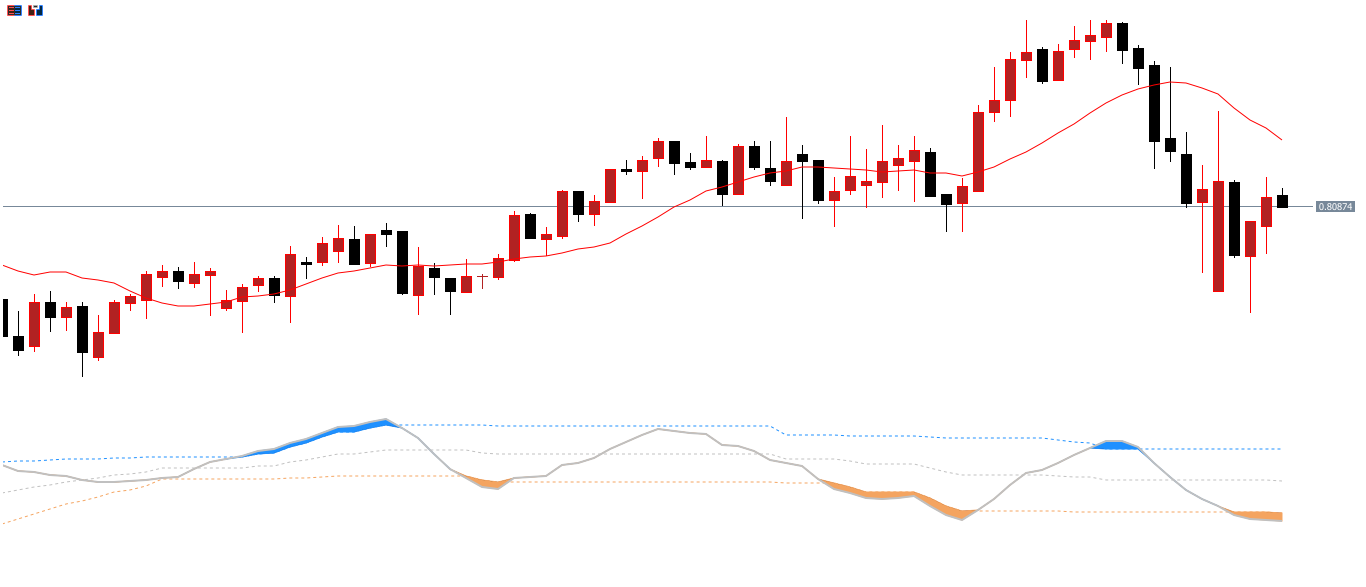
When the line moves above the overbought threshold, it turns blue, signaling high prices or a continuation of a strong uptrend. When it falls below oversold levels, it turns orange, signaling low prices or bearish continuation.
This color-changing feature makes momentum shifts easy to see even at a glance, helping traders catch early reversal setups.
How to Read the Double Stochastic RSI Indicator
Overbought Conditions
When the main line moves above the overbought zone and turns blue, it can mean:
The market is overstretched to the upside
A bullish run may soon weaken
A potential reversal could form if price confirms
Oversold Conditions
When the line drops below the oversold zone and turns orange:
Prices may be excessively low
Bears may be losing strength
A bullish reversal becomes likely if confirmed by additional analysis
This indicator excels in momentum reversal trading, where traders look for normalization after an extreme price move.
How Accurate Is the Double Stochastic RSI Indicator?
The Double Stochastic RSI is not a magical arrow indicator, nor does it guarantee perfect signals. Like all oscillators, it can produce false alerts—especially in trending conditions. Traders looking for a guaranteed 5:1 reward ratio will be disappointed.
However, when paired with Support And Resistance, moving averages, or Price Action, the indicator becomes far more accurate and reliable.
Buy Signal Strategy
A BUY signal forms when:
The indicator’s main line moves out of oversold territory
Price retests a former resistance level, which now acts as support
This combination creates a strong reversal setup.
For example, if price breaks above a resistance level and later returns to test it, the Double Stochastic RSI crossing upward reinforces a bullish entry.
Entry rules:
Enter long at the open of the next candle after the signal
Place stop loss below the previous swing low
Take profit when a counter signal appears or based on risk–reward targets
Sell Signal Strategy
A SELL signal forms when:
The main line moves out of the overbought zone
The moving average or overall trend shows bearish direction
Entry rules:
Enter short once the indicator turns downward
Place stop loss above the last swing high
Exit on an opposite signal or your preferred TP method
Advantages and Disadvantages of the Double Stochastic RSI Indicator
Advantages
Identifies reversal entry points
Works across forex, stocks, crypto, indices
Highly customizable levels
Suitable for intraday and long-term traders
Non-repainting
Disadvantages
No built-in alerts
Generates false signals in strong trends
Requires additional confirmation (candle patterns, S/R, volume, MA)
To increase accuracy, combine this tool with volume analysis, moving averages, or price action methods.
Conclusion
The Double Stochastic RSI Indicator MT5 offers traders a powerful blend of RSI stability and Stochastic sensitivity, making it ideal for detecting reversal zones and overextended price conditions. While it delivers reliable momentum analysis, it's not a standalone indicator. The best results come from combining it with support/resistance, Trend Confirmation, and candle patterns.
FAQ
1 Download
Published:
Nov 25, 2025 09:34 AM
Category: