The Weis Volume Indicator, developed by market analyst David Weis, is a powerful tool for understanding price and volume dynamics in the forex market. Inspired by Weis’s book “Trades About to Happen: A Wyckoff Method”, the indicator focuses on the concept that price and volume move in waves rather than in equal proportions.
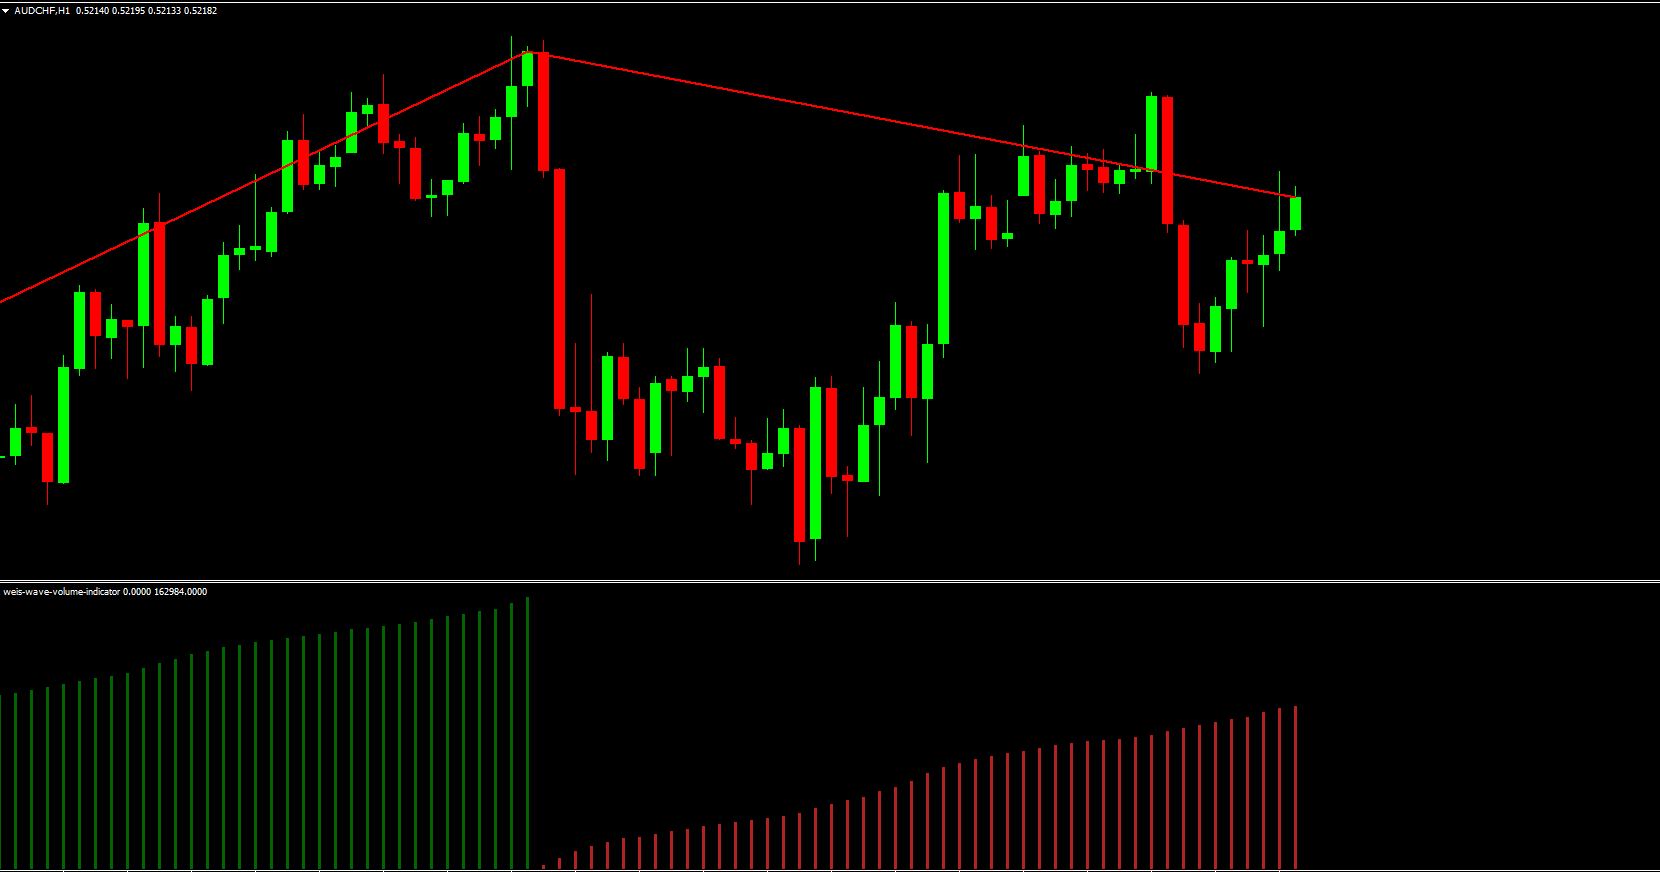
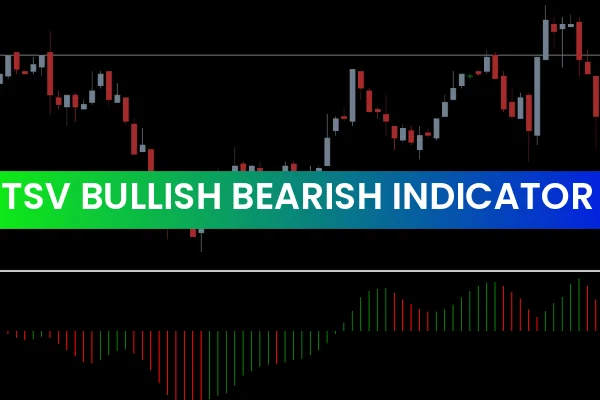
The indicator is composed of a wave representing trend direction and volume bars at the bottom of the chart. These components help traders visualize bullish and bearish pressure and make informed trading decisions.
For traders looking for complementary tools, the Better Volume New Alerts Indicator and Volume Divergence Indicator pair well with the Weis method, providing additional confirmation of volume-based trends.
How the Weis Volume Indicator Works
The indicator uses color-coded bars and waves to signal market trends:
Green bars: Indicate bullish pressure and upward-trending waves.
Red bars: Indicate bearish pressure and downward-trending waves.
Numeric volume display: Shows the volume of each bar, helping traders identify high or low pressure in the market.
The wave structure combined with the volume bars allows traders to pinpoint potential entry and exit points and analyze market strength during sideways movements.
How to Trade the Weis Volume Indicator
The core principle of the Weis Volume Indicator is volume analysis, which is closely tied to Supply And Demand dynamics.
High volume: Signals the best time to enter trades.
Low volume: Indicates a potential exit.
Wave dips: Signal buying opportunities.
Wave peaks: Indicate selling opportunities.
Weis Volume Indicator Buy Strategy
Ensure the indicator shows high volume.
Wait for the wave to move upwards.
Enter the trade at the green bar.
Place a stop-loss near the low of the buying point.
Exit when the bar changes color.
Weis Volume Indicator Sell Strategy
Ensure the indicator shows high volume.
Wait for the wave to move downwards.
Enter the trade at the red bar.
Place a stop-loss near the high of the selling point.
Exit when the bar changes color.
Pros and Cons
Pros:
Visualizes bullish/bearish pressure via color-coded bars.
Numeric display provides real-time volume insight.
Effective across all timeframes.
Easy to interpret for Wyckoff-style traders.
Pairs well with RSI, MACD, and divergence tools.
Cons:
Can produce false signals during low-volume periods.
Requires basic knowledge of volume-based trading.
No explicit buy/sell alerts.
Numeric overlays may appear cluttered for some traders.
Conclusion
The Weis Volume Indicator is a versatile tool suitable for swing and trend trading strategies. It works best on higher timeframes such as H1 and H4, where volume spikes are more meaningful. Combining the indicator with RSI, MACD, or other trend tools can reduce false signals and improve trading efficiency.
The intuitive visual display makes it beginner-friendly, while the wave and volume analysis provide depth for advanced traders.
For more tools and trading strategies, visit IndicatorForest.com.
FAQ
6 Downloads
Published:
Nov 24, 2025 11:52 AM
Category: