The Dolly Indicator for MT4 is a powerful forex trading tool that identifies support, resistance, and pivot levels to provide accurate buy and sell trading signals. This indicator is especially useful for scalpers and intraday traders, as it automatically calculates buy stop and sell stop levels in advance, allowing traders to anticipate market reversals or breakouts.
The indicator is simple, intuitive, and suitable for both beginners and experienced forex traders, offering clear trade recommendations, including entry, stop loss, and take profit targets directly on the chart.
How the Dolly Indicator Works
The Dolly Indicator uses a combination of pivot points and support/resistance calculations to determine the key price zones where the market is likely to react.
It automatically plots:
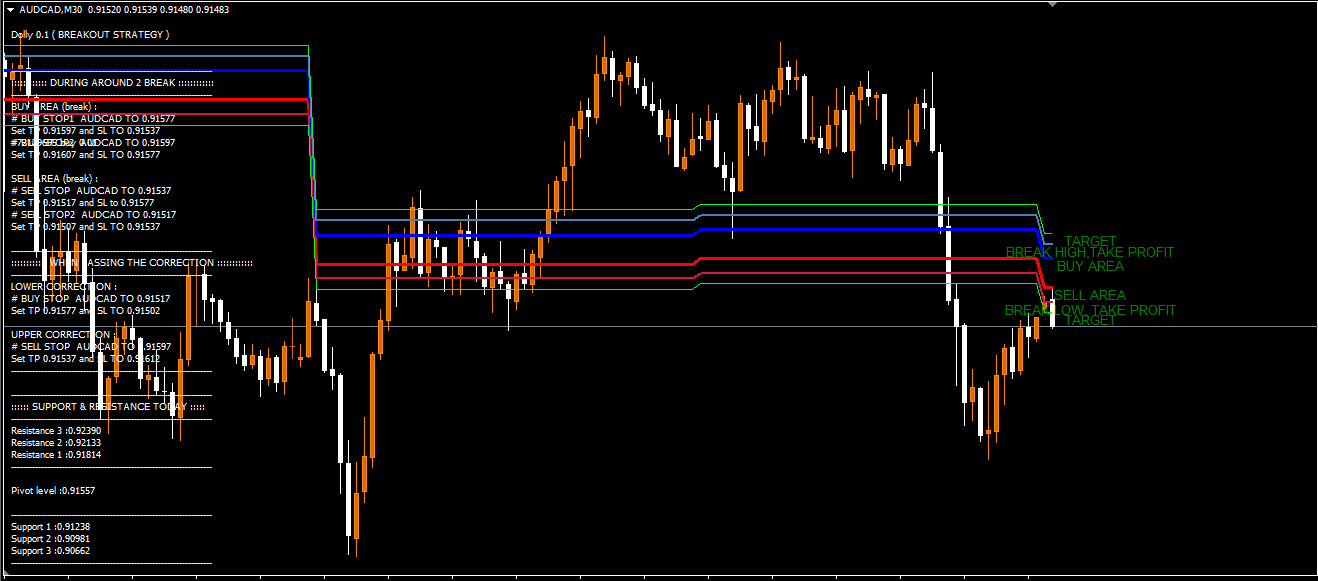
Pivot levels (P) – the central reference level.
Support levels (S1, S2, S3) – potential buy or reversal zones.
Resistance levels (R1, R2, R3) – potential sell or breakout zones.
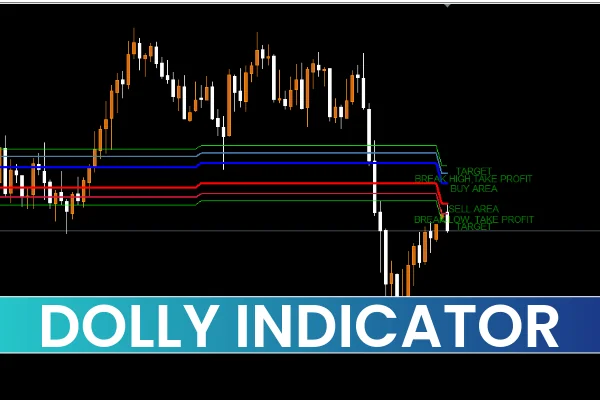
On the chart, the blue lines represent support and buy areas, while the red lines mark resistance and sell areas. The indicator also displays trading recommendations, including buy stop and sell stop prices, in the comments section of the MT4 chart window.
How to Trade with the Dolly Indicator for MT4
The image above shows the GBP/JPY M15 chart with the Dolly Indicator applied. Here’s how traders can use it effectively:
Identify Buy and Sell Zones
The blue zone marks potential buy areas, where the price might bounce upward.
The red zone highlights potential sell areas, where price could reverse downward.
Follow the Buy Stop/Sell Stop Instructions
The indicator provides clear trade recommendations:
A Buy Stop signal appears when the price is expected to break above resistance.
A Sell Stop signal appears when the price is likely to break below support.
Traders can place pending orders accordingly, ensuring they trade in the direction of the breakout.
Manage Risk with Built-in Stop Loss and Take Profit
Each trading setup includes stop loss and take profit levels, helping traders manage risk efficiently. This makes the Dolly Indicator particularly convenient for beginners who struggle with money management and trade placement.
Tips for Using the Dolly Indicator Effectively
While the Dolly Indicator provides reliable pivot-based trade recommendations, it’s essential to use it with market context and trend analysis in mind.
During strong trending markets, Support And Resistance levels may be temporarily invalidated. In such cases, it’s best to confirm signals with indicators like Moving Averages, ADX, or MACD.
For sideways markets, the Dolly Indicator performs well, helping traders identify short-term bounces and breakouts.
It works best on lower timeframes such as M1, M5, and M15, making it ideal for Scalping strategies.
Key Benefits of the Dolly Indicator for MT4
Automatically calculates pivot, support, and resistance levels.
Provides clear buy stop and sell stop trading signals.
Includes stop loss and take profit recommendations.
Works effectively on smaller timeframes for day trading and scalping.
Ideal for both new and experienced forex traders.
How to Download and Install the Dolly Indicator for MT4
To install the Dolly Indicator for MT4:
Download the indicator file (.mq4 or .ex4).
Copy it to your Indicators folder located in the MQL4 directory of your MetaTrader 4.
Restart MT4 and attach the indicator to your chart.
Customize the settings as needed for your preferred trading style.
Once installed, you’ll see the buy/sell zones, pivot levels, and trade recommendations displayed directly on your chart.
Conclusion
The Dolly Indicator for MT4 is an excellent forex trading tool that combines support and resistance, pivot levels, and clear trade signals to simplify decision-making for traders. By offering buy stop and sell stop recommendations in advance, it allows users to anticipate key price movements and manage trades effectively.
Whether you’re a beginner or an advanced trader, the Dolly Indicator provides a complete framework for identifying potential reversals and breakout zones on lower timeframe charts.
FAQ
1 Download
Published:
Nov 07, 2025 01:59 AM
Category: